Implementing modern evals and observability
A practical operating model for testing, tracing, and improving LLM and agentic systems in production.
 DeepEval
  OpenRouter
 Evals and observability are one quality loop. Evals ask whether known behaviours still hold; observability explains what happened in real runs, with real context, tools, cost, latency, and failure modes.
The useful question is not which framework to use first. It is what evidence would convince the team that an AI workflow is safe enough to ship, reliable enough to operate, and debuggable enough to improve.
Modern eval practice is trace-first and workflow-first. Instrument the product so each meaningful AI run leaves behind enough evidence to replay what happened, label what mattered, convert representative cases into datasets, run the right eval type, and feed production failures back into the next release decision.
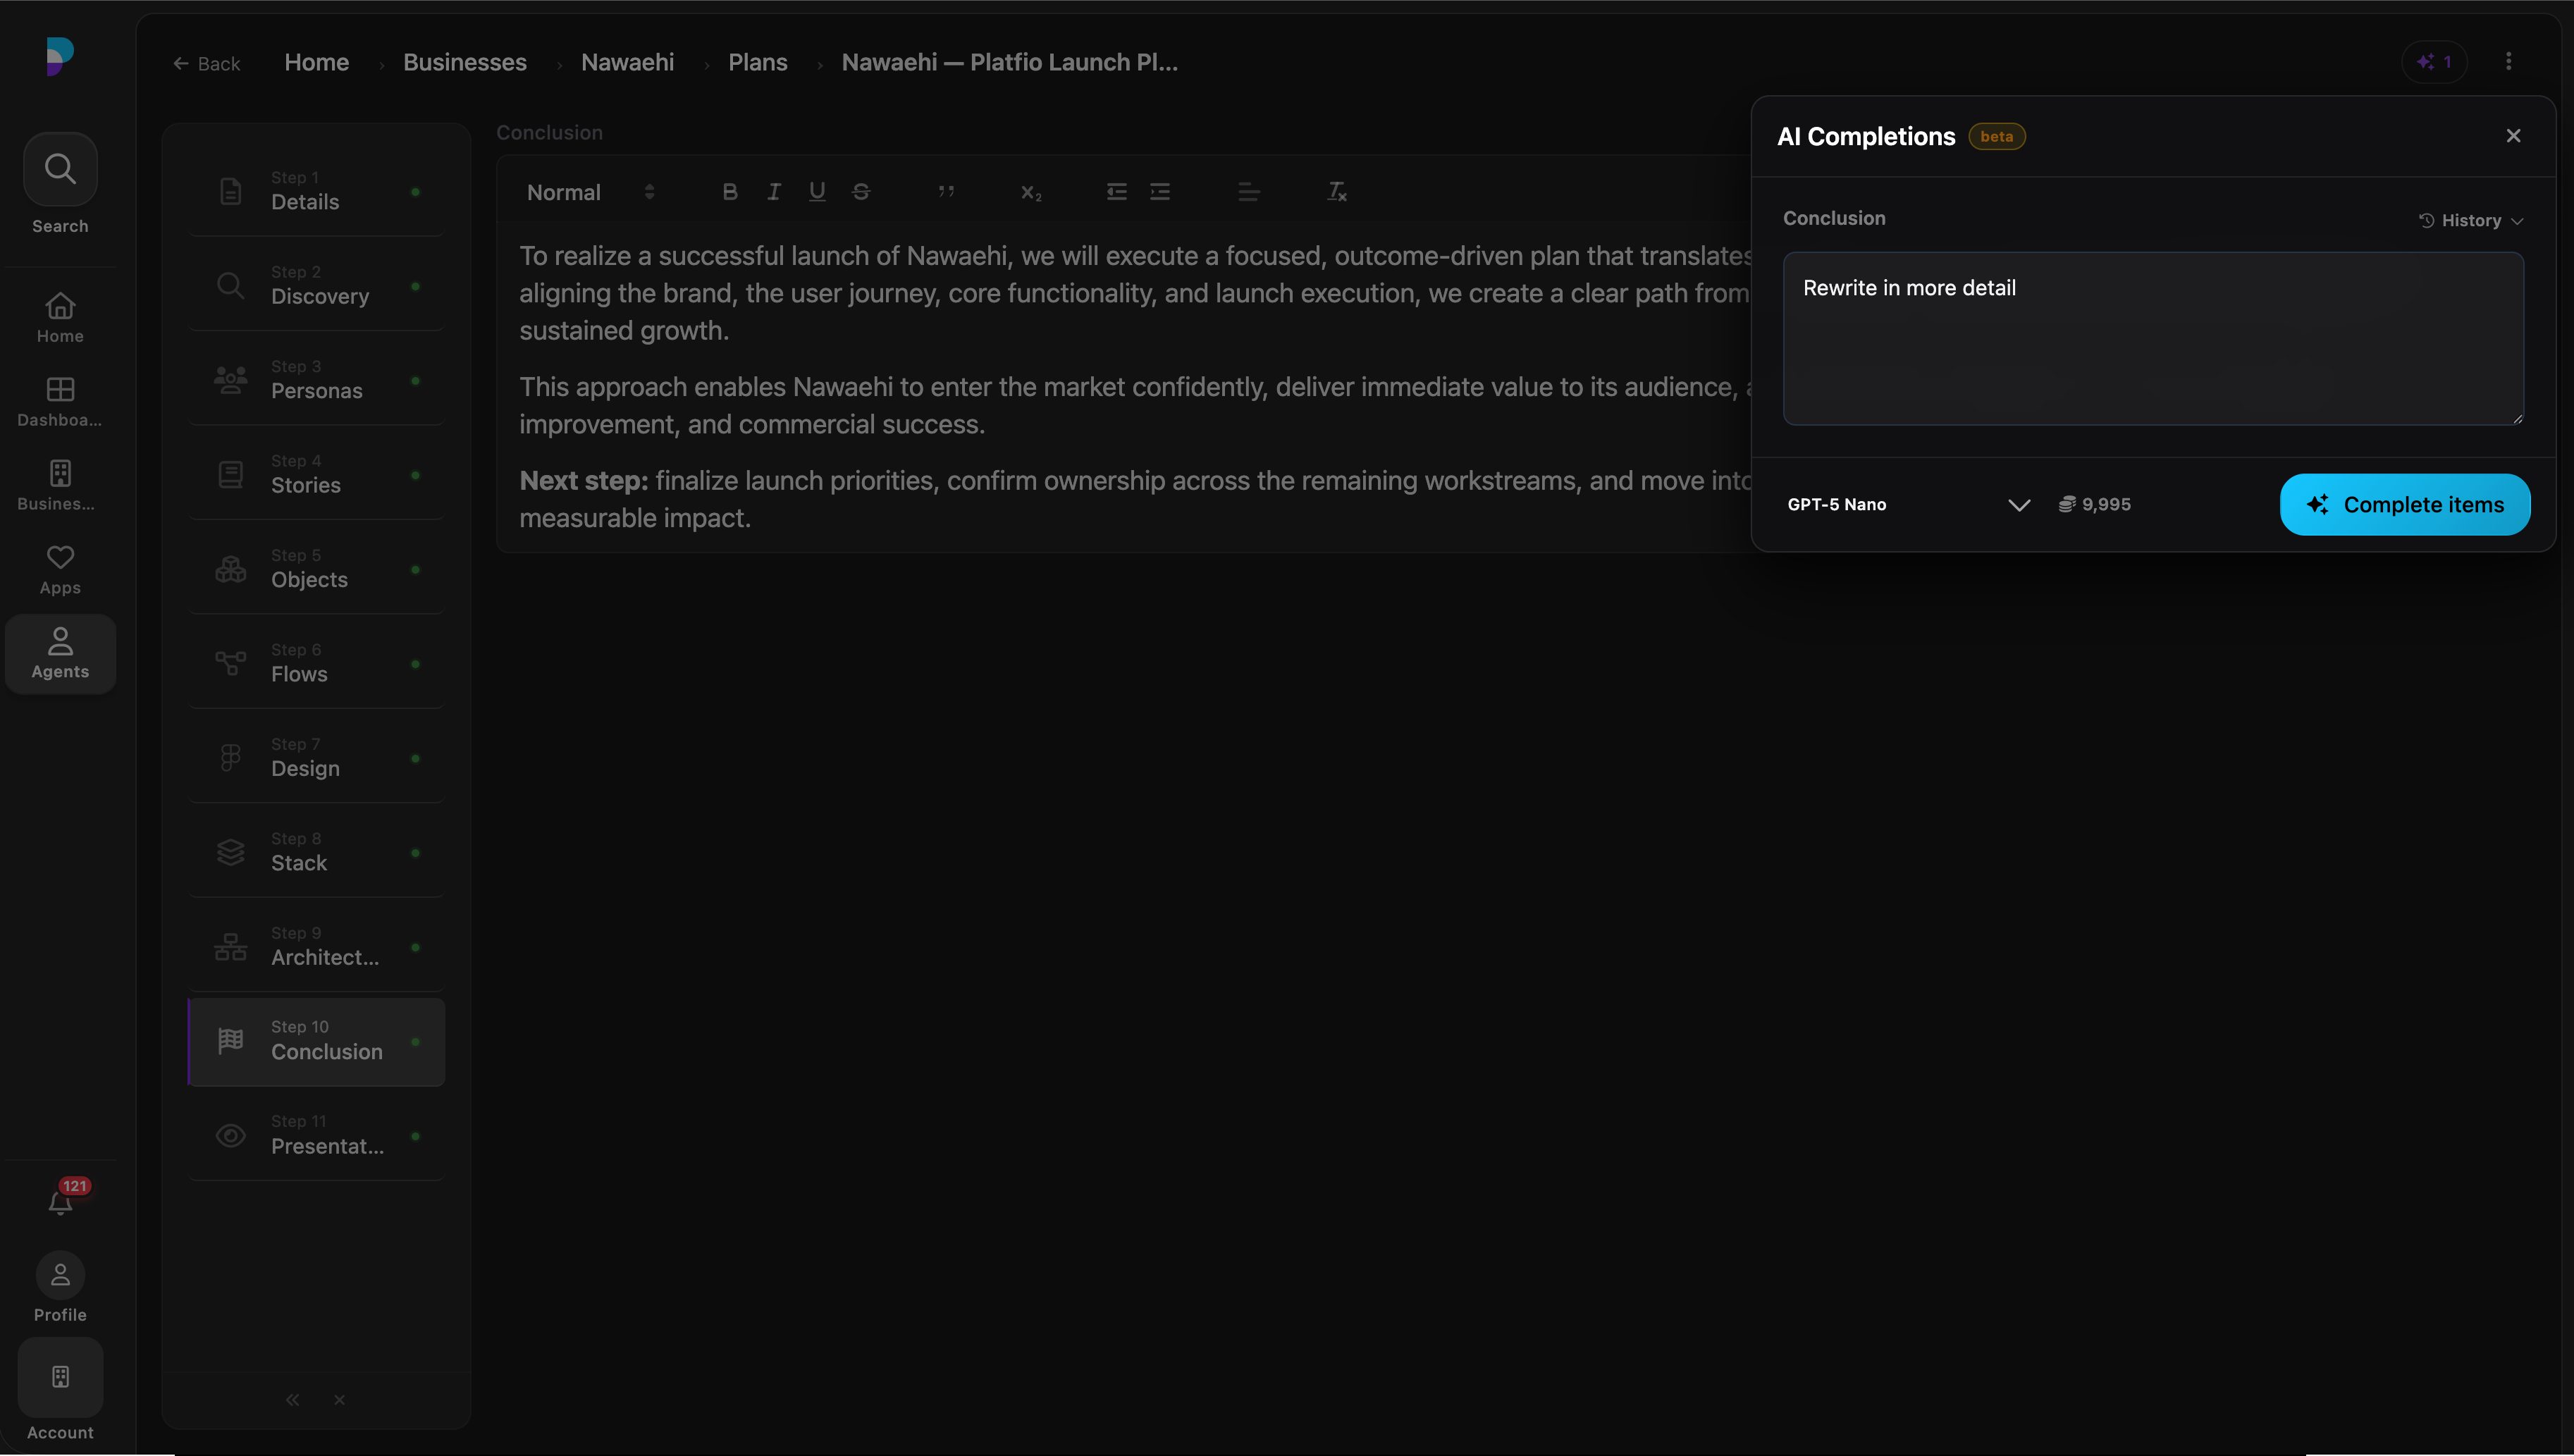
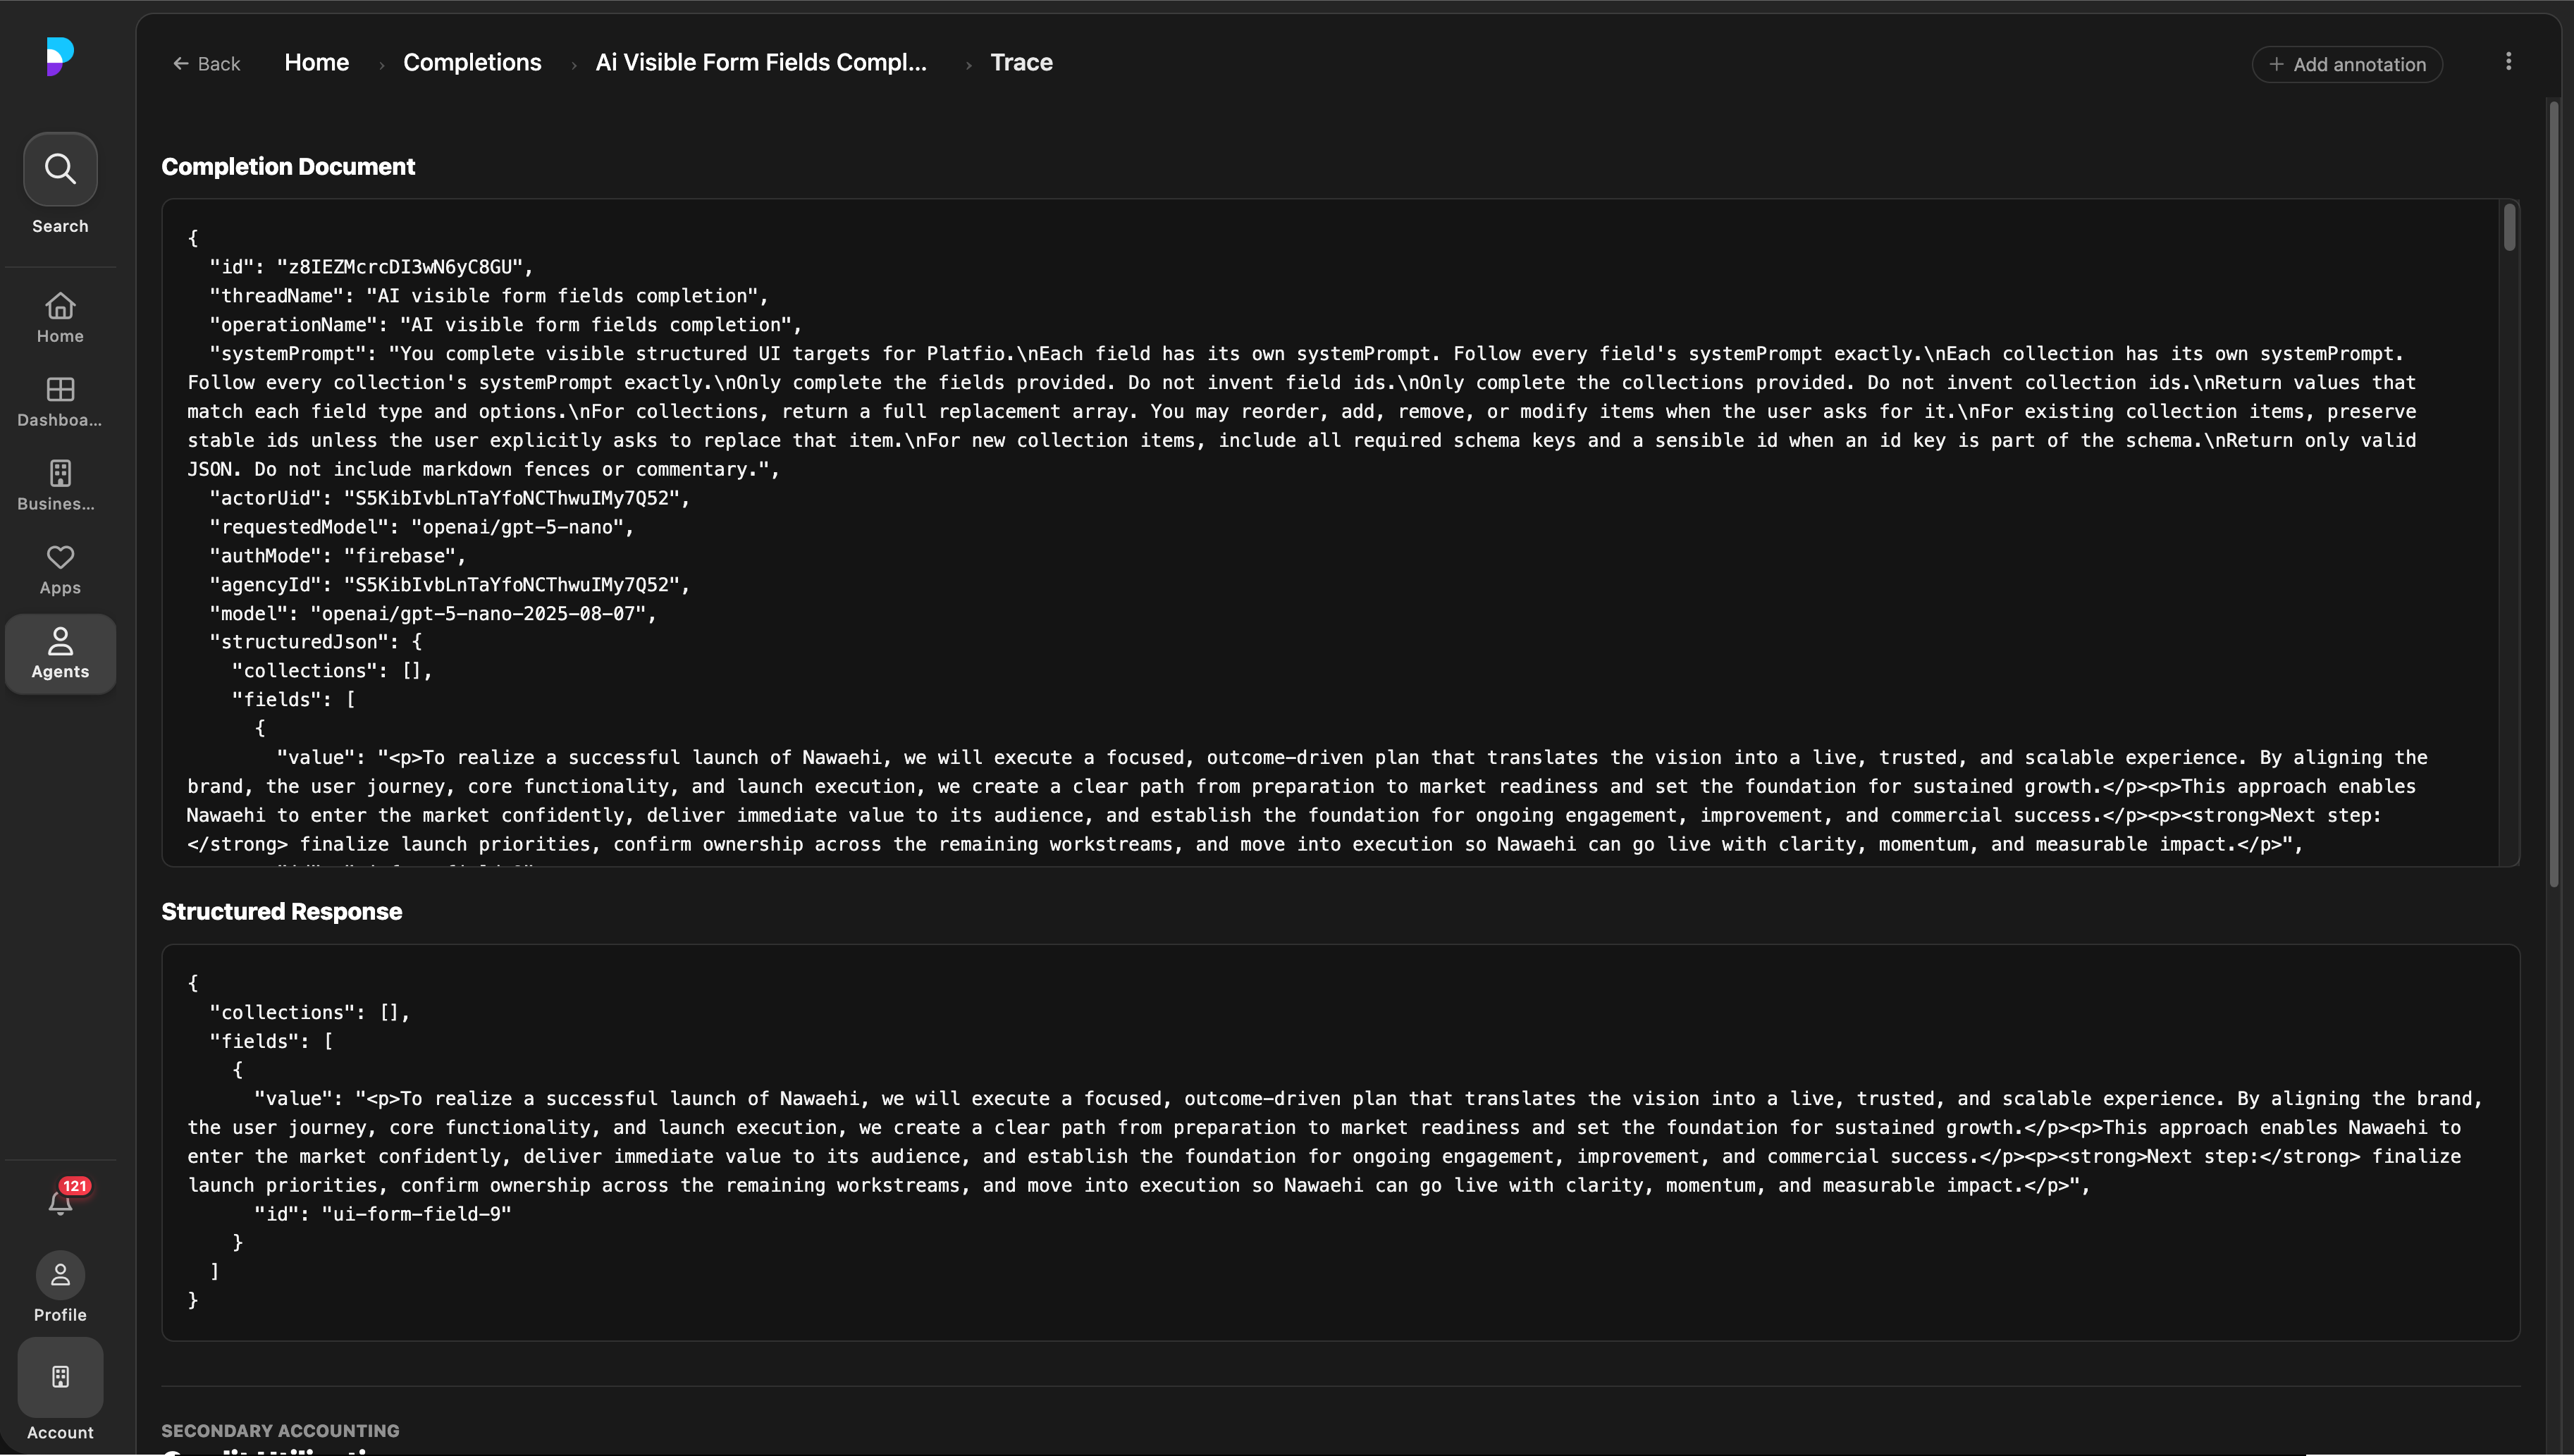
Single-turn completion surface
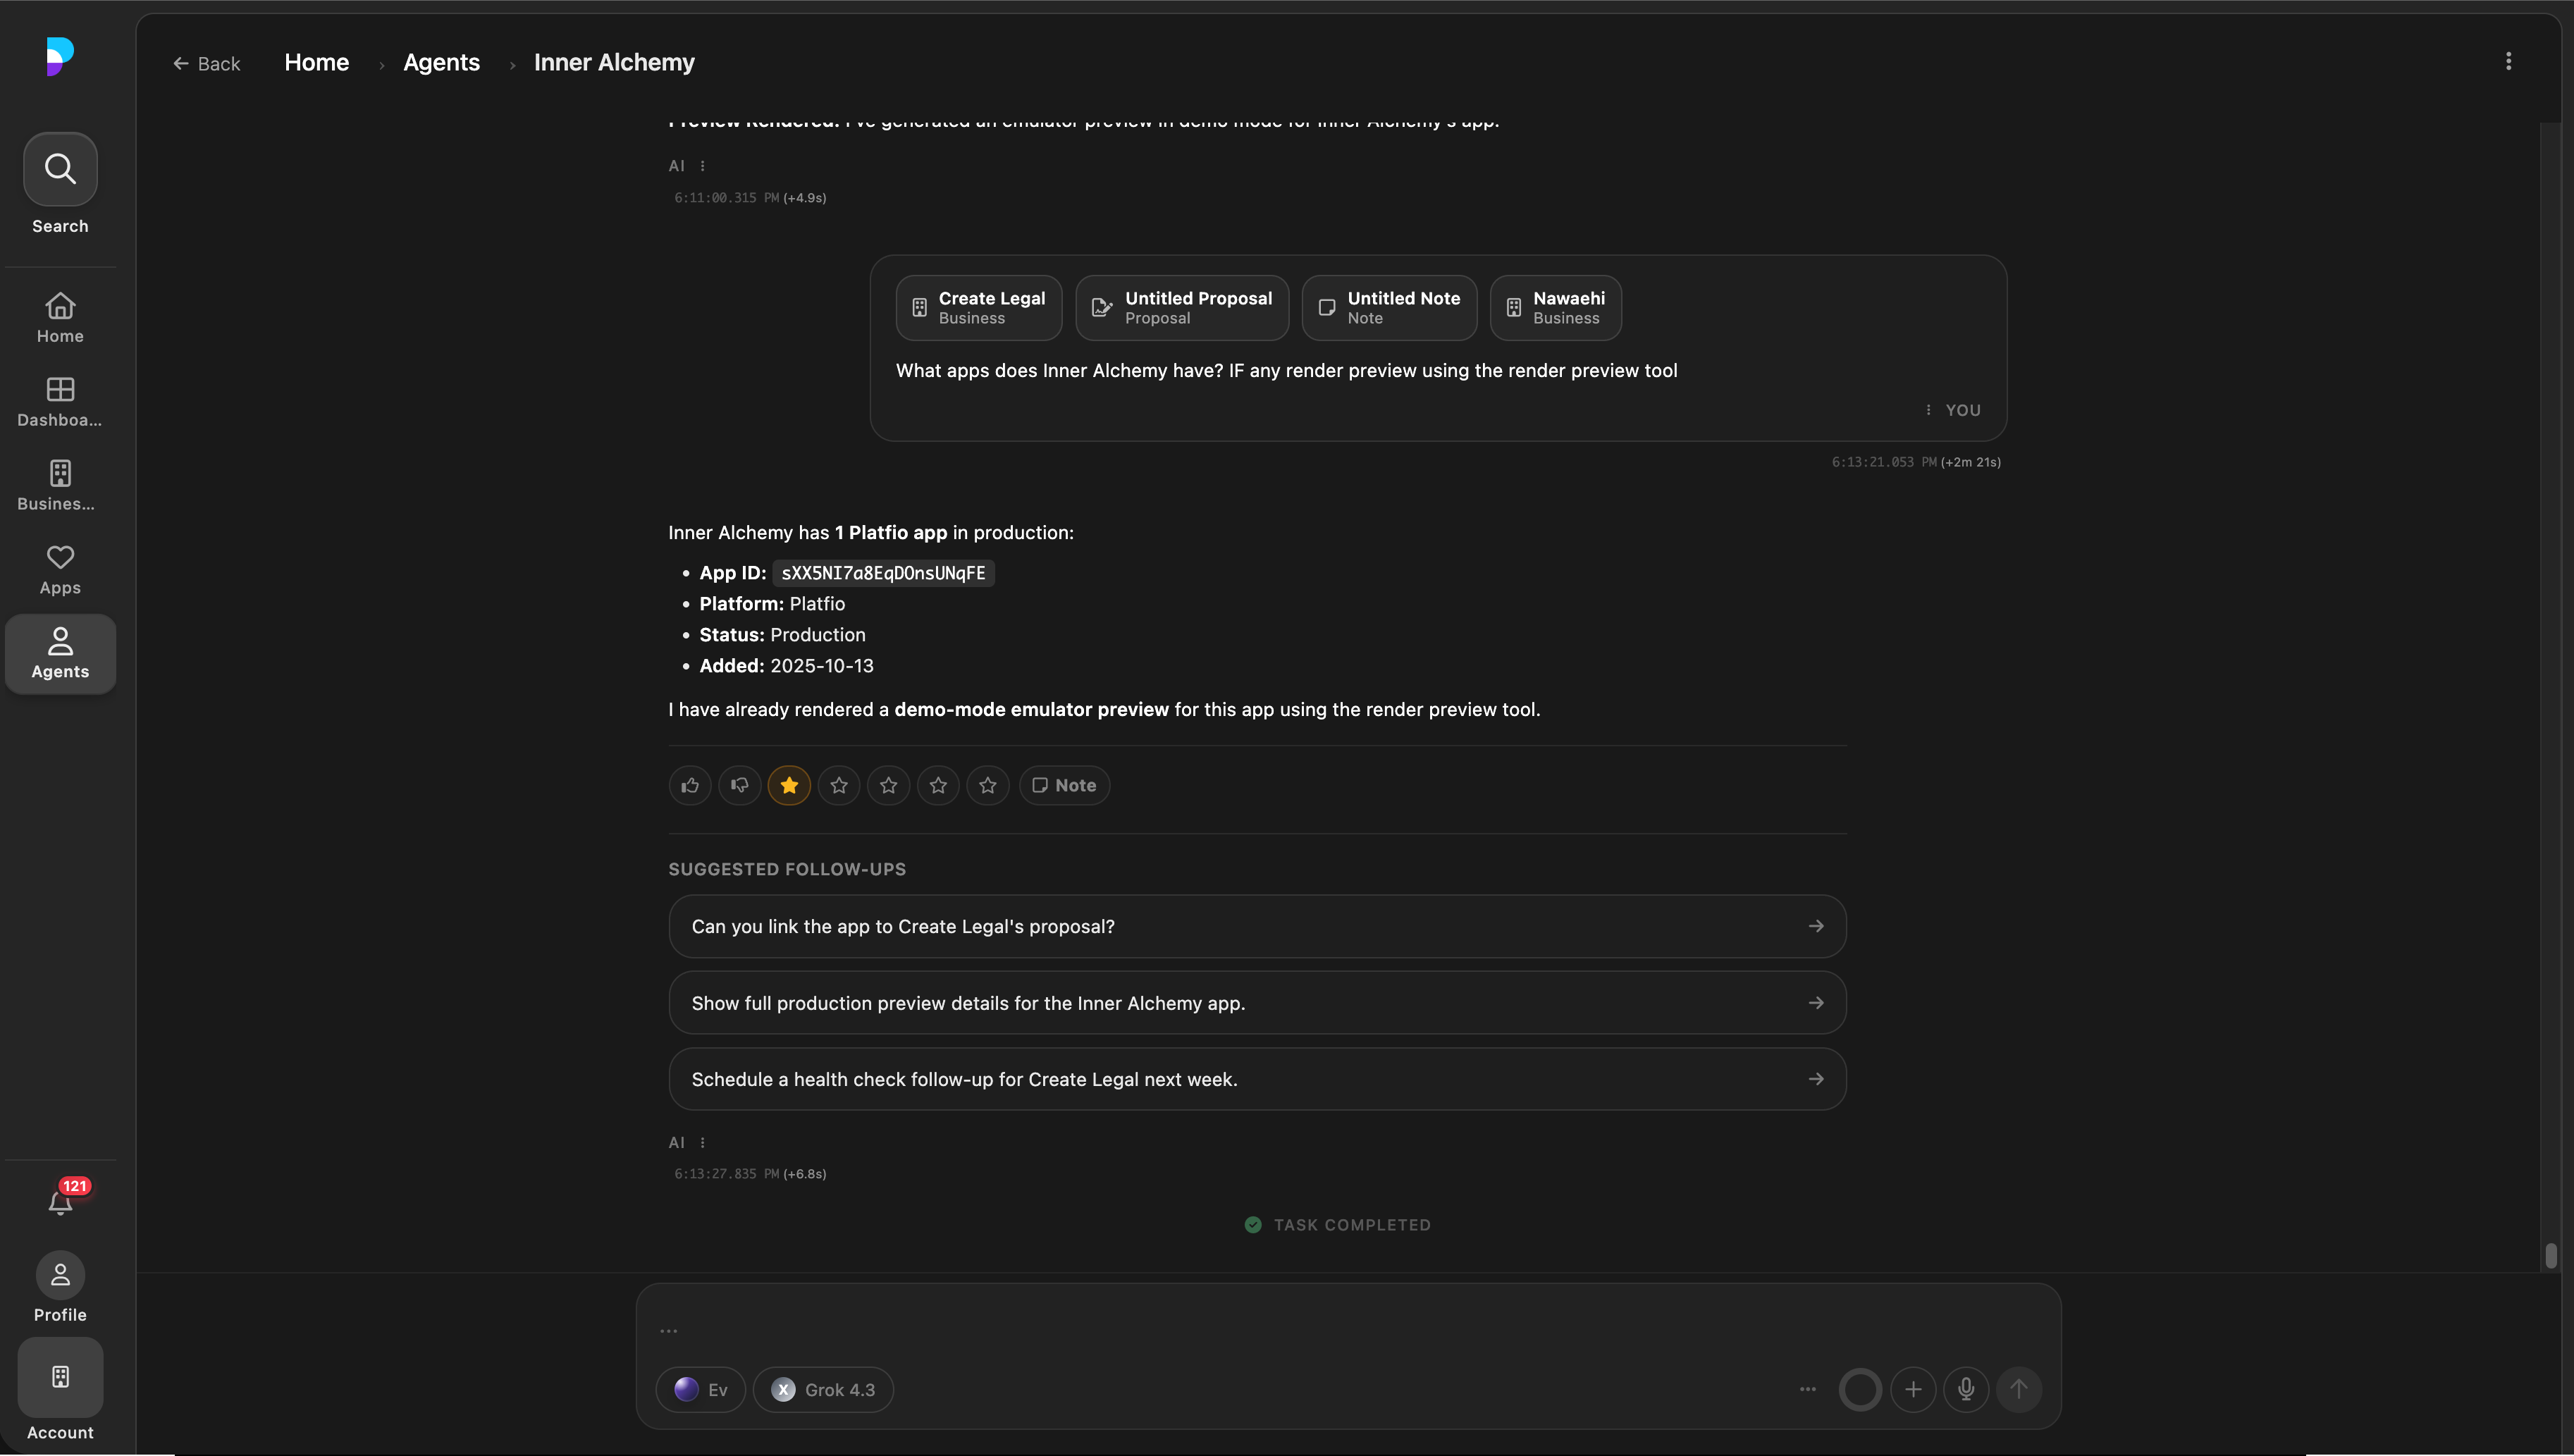
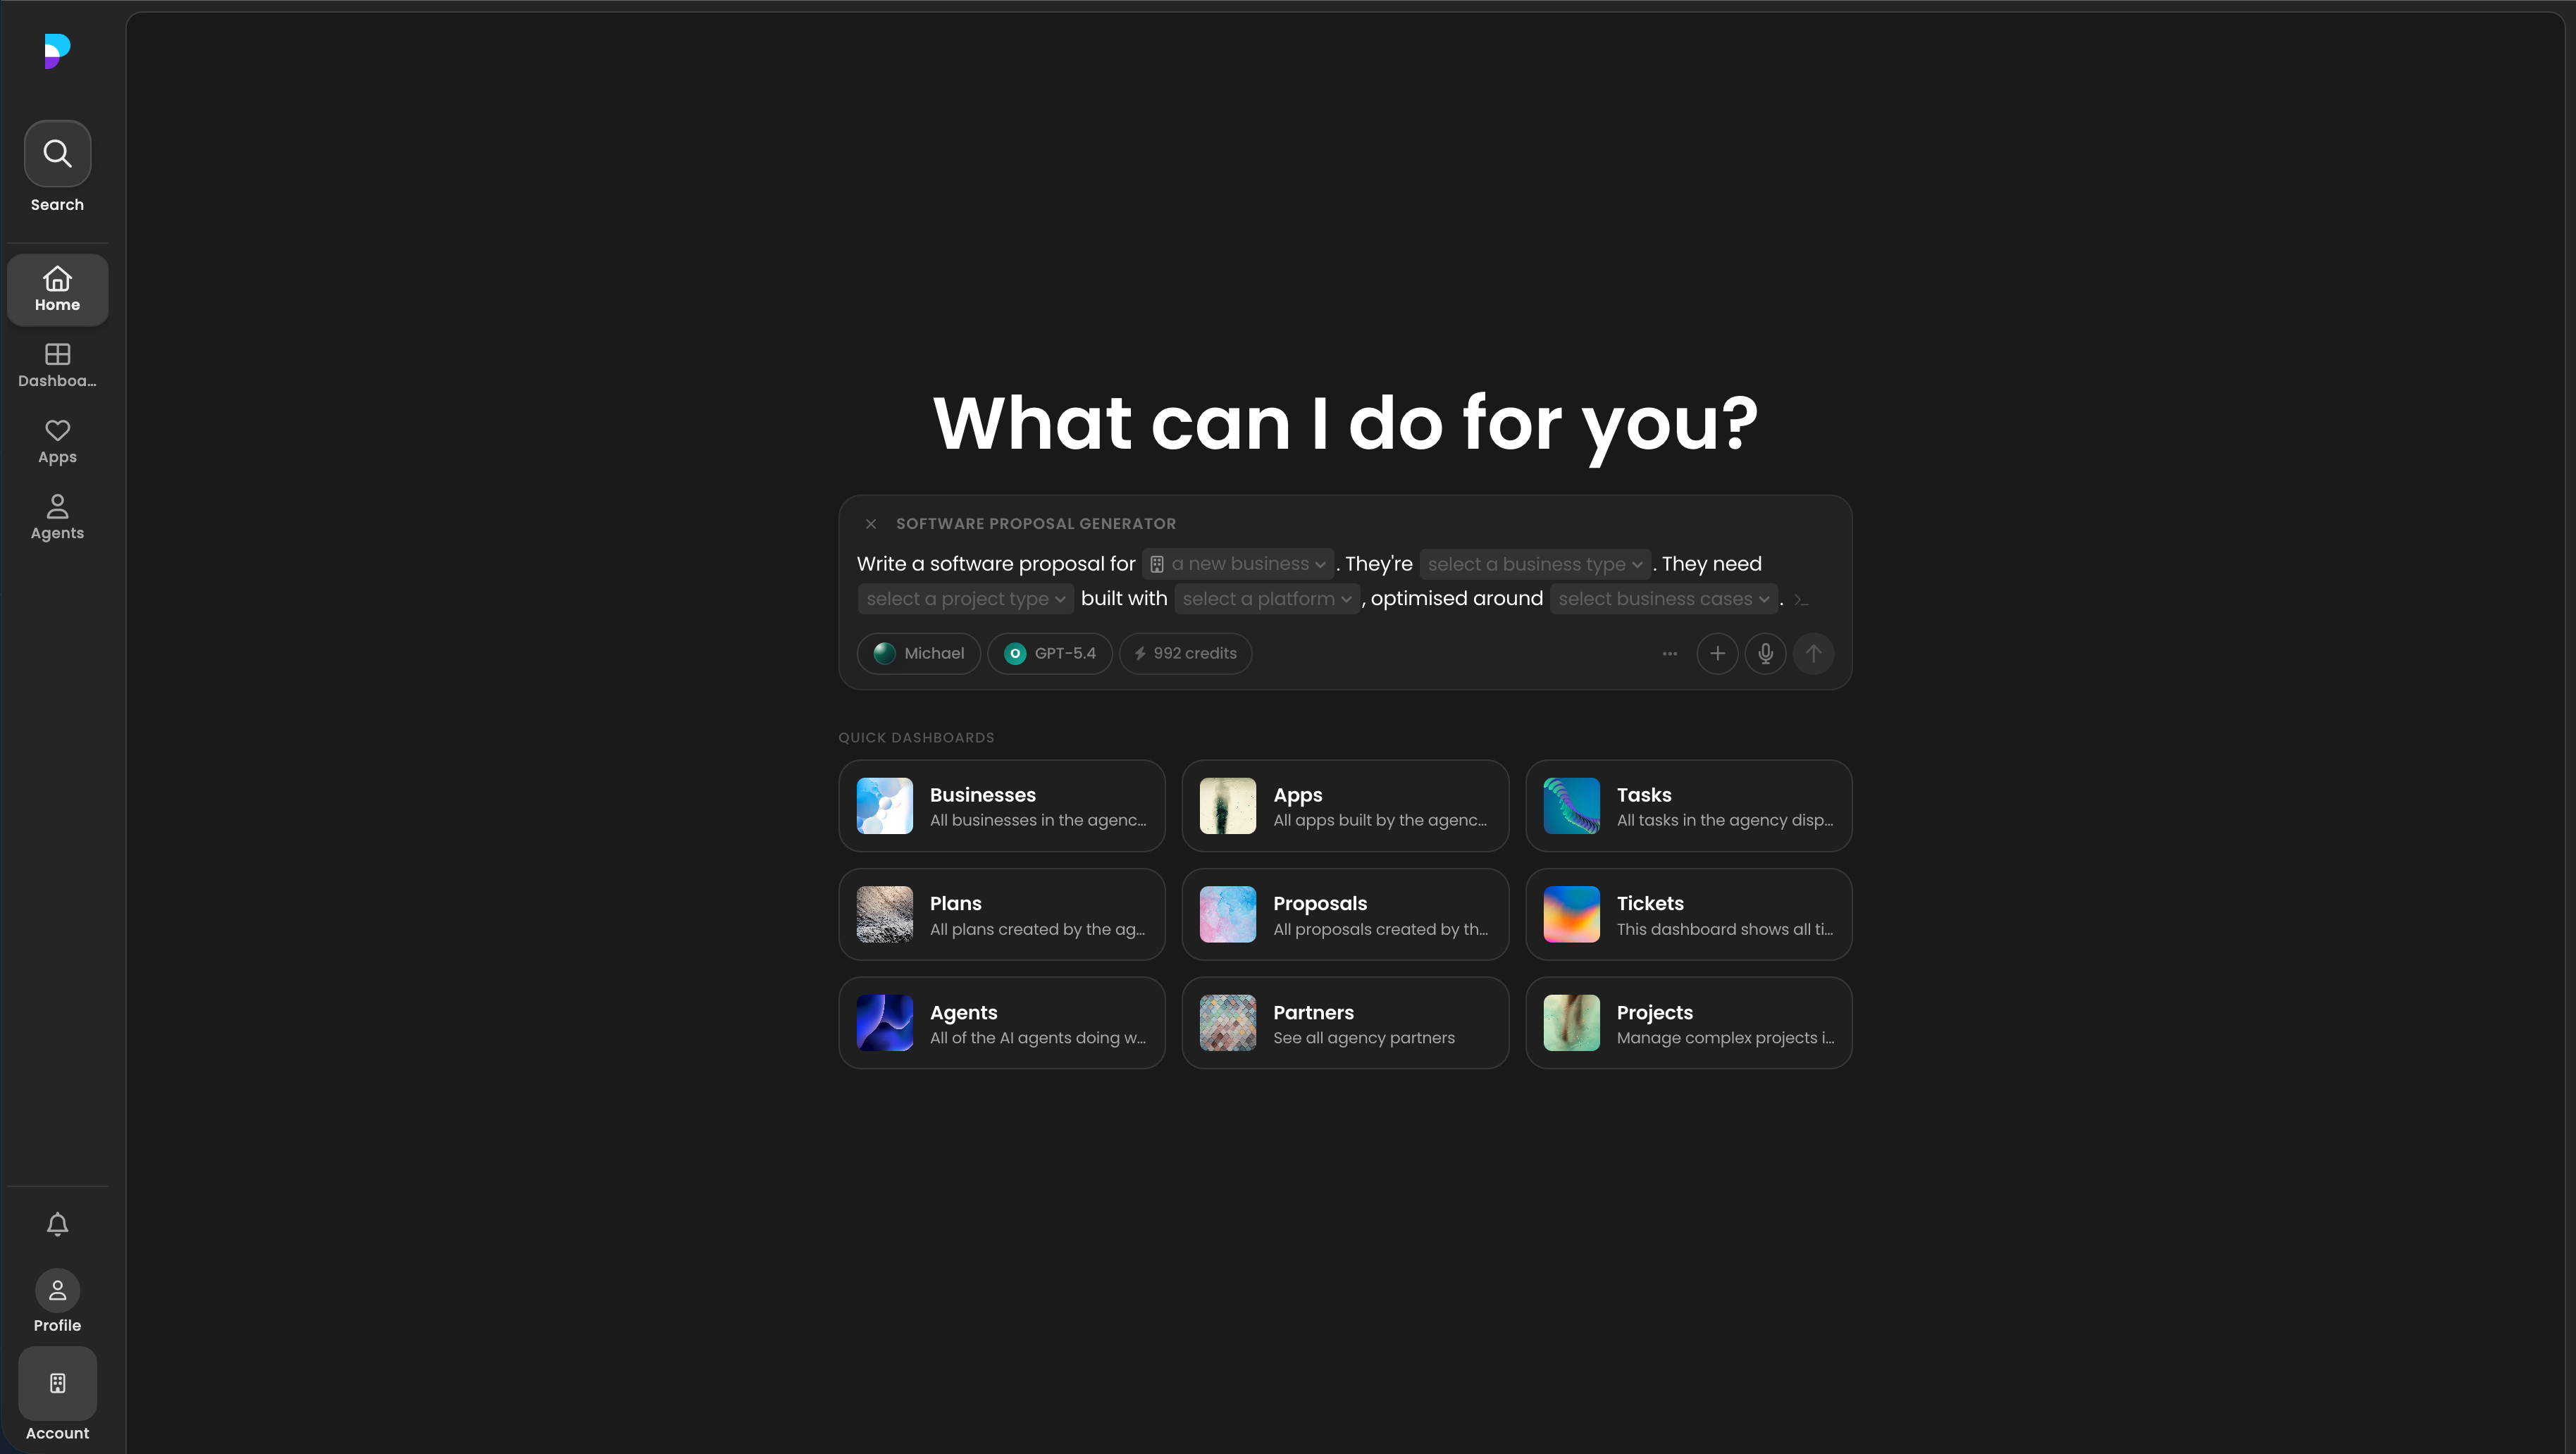
Multi-turn conversation surface
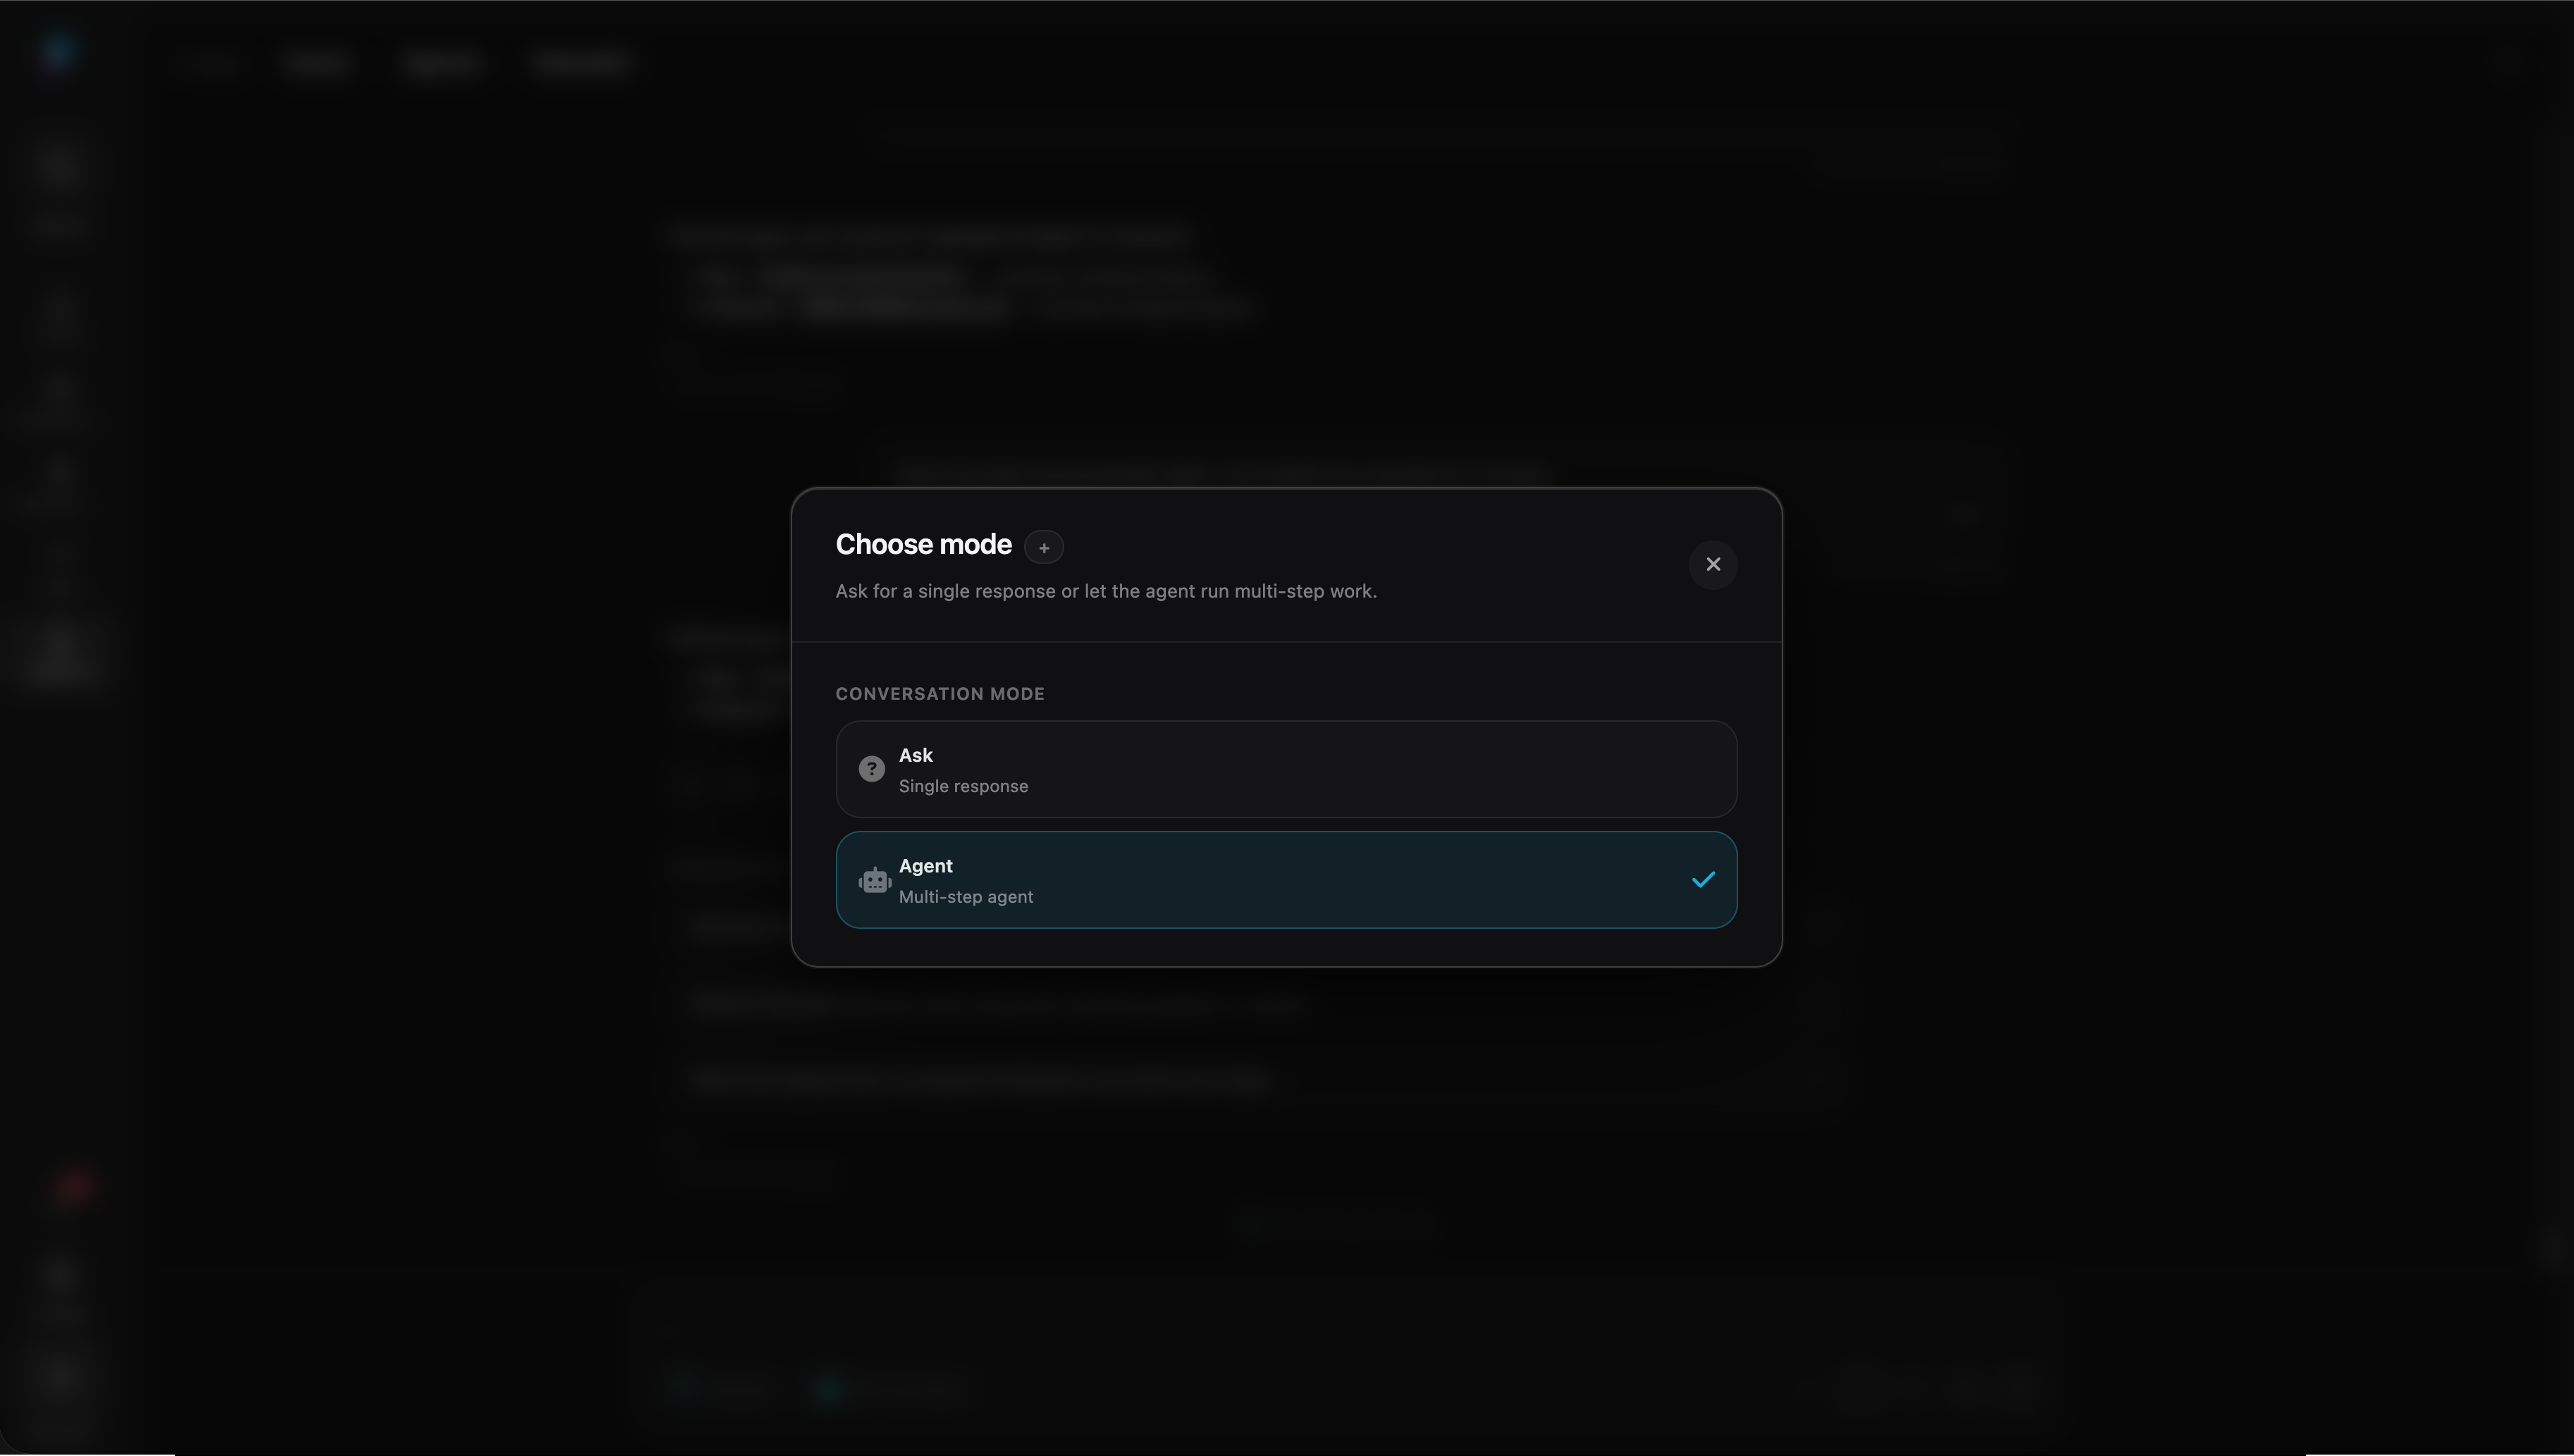
Agentic mode detail: multi-turn is the default path, with tool access scoped per thread.
Mode toggle promotes chat into agentic work
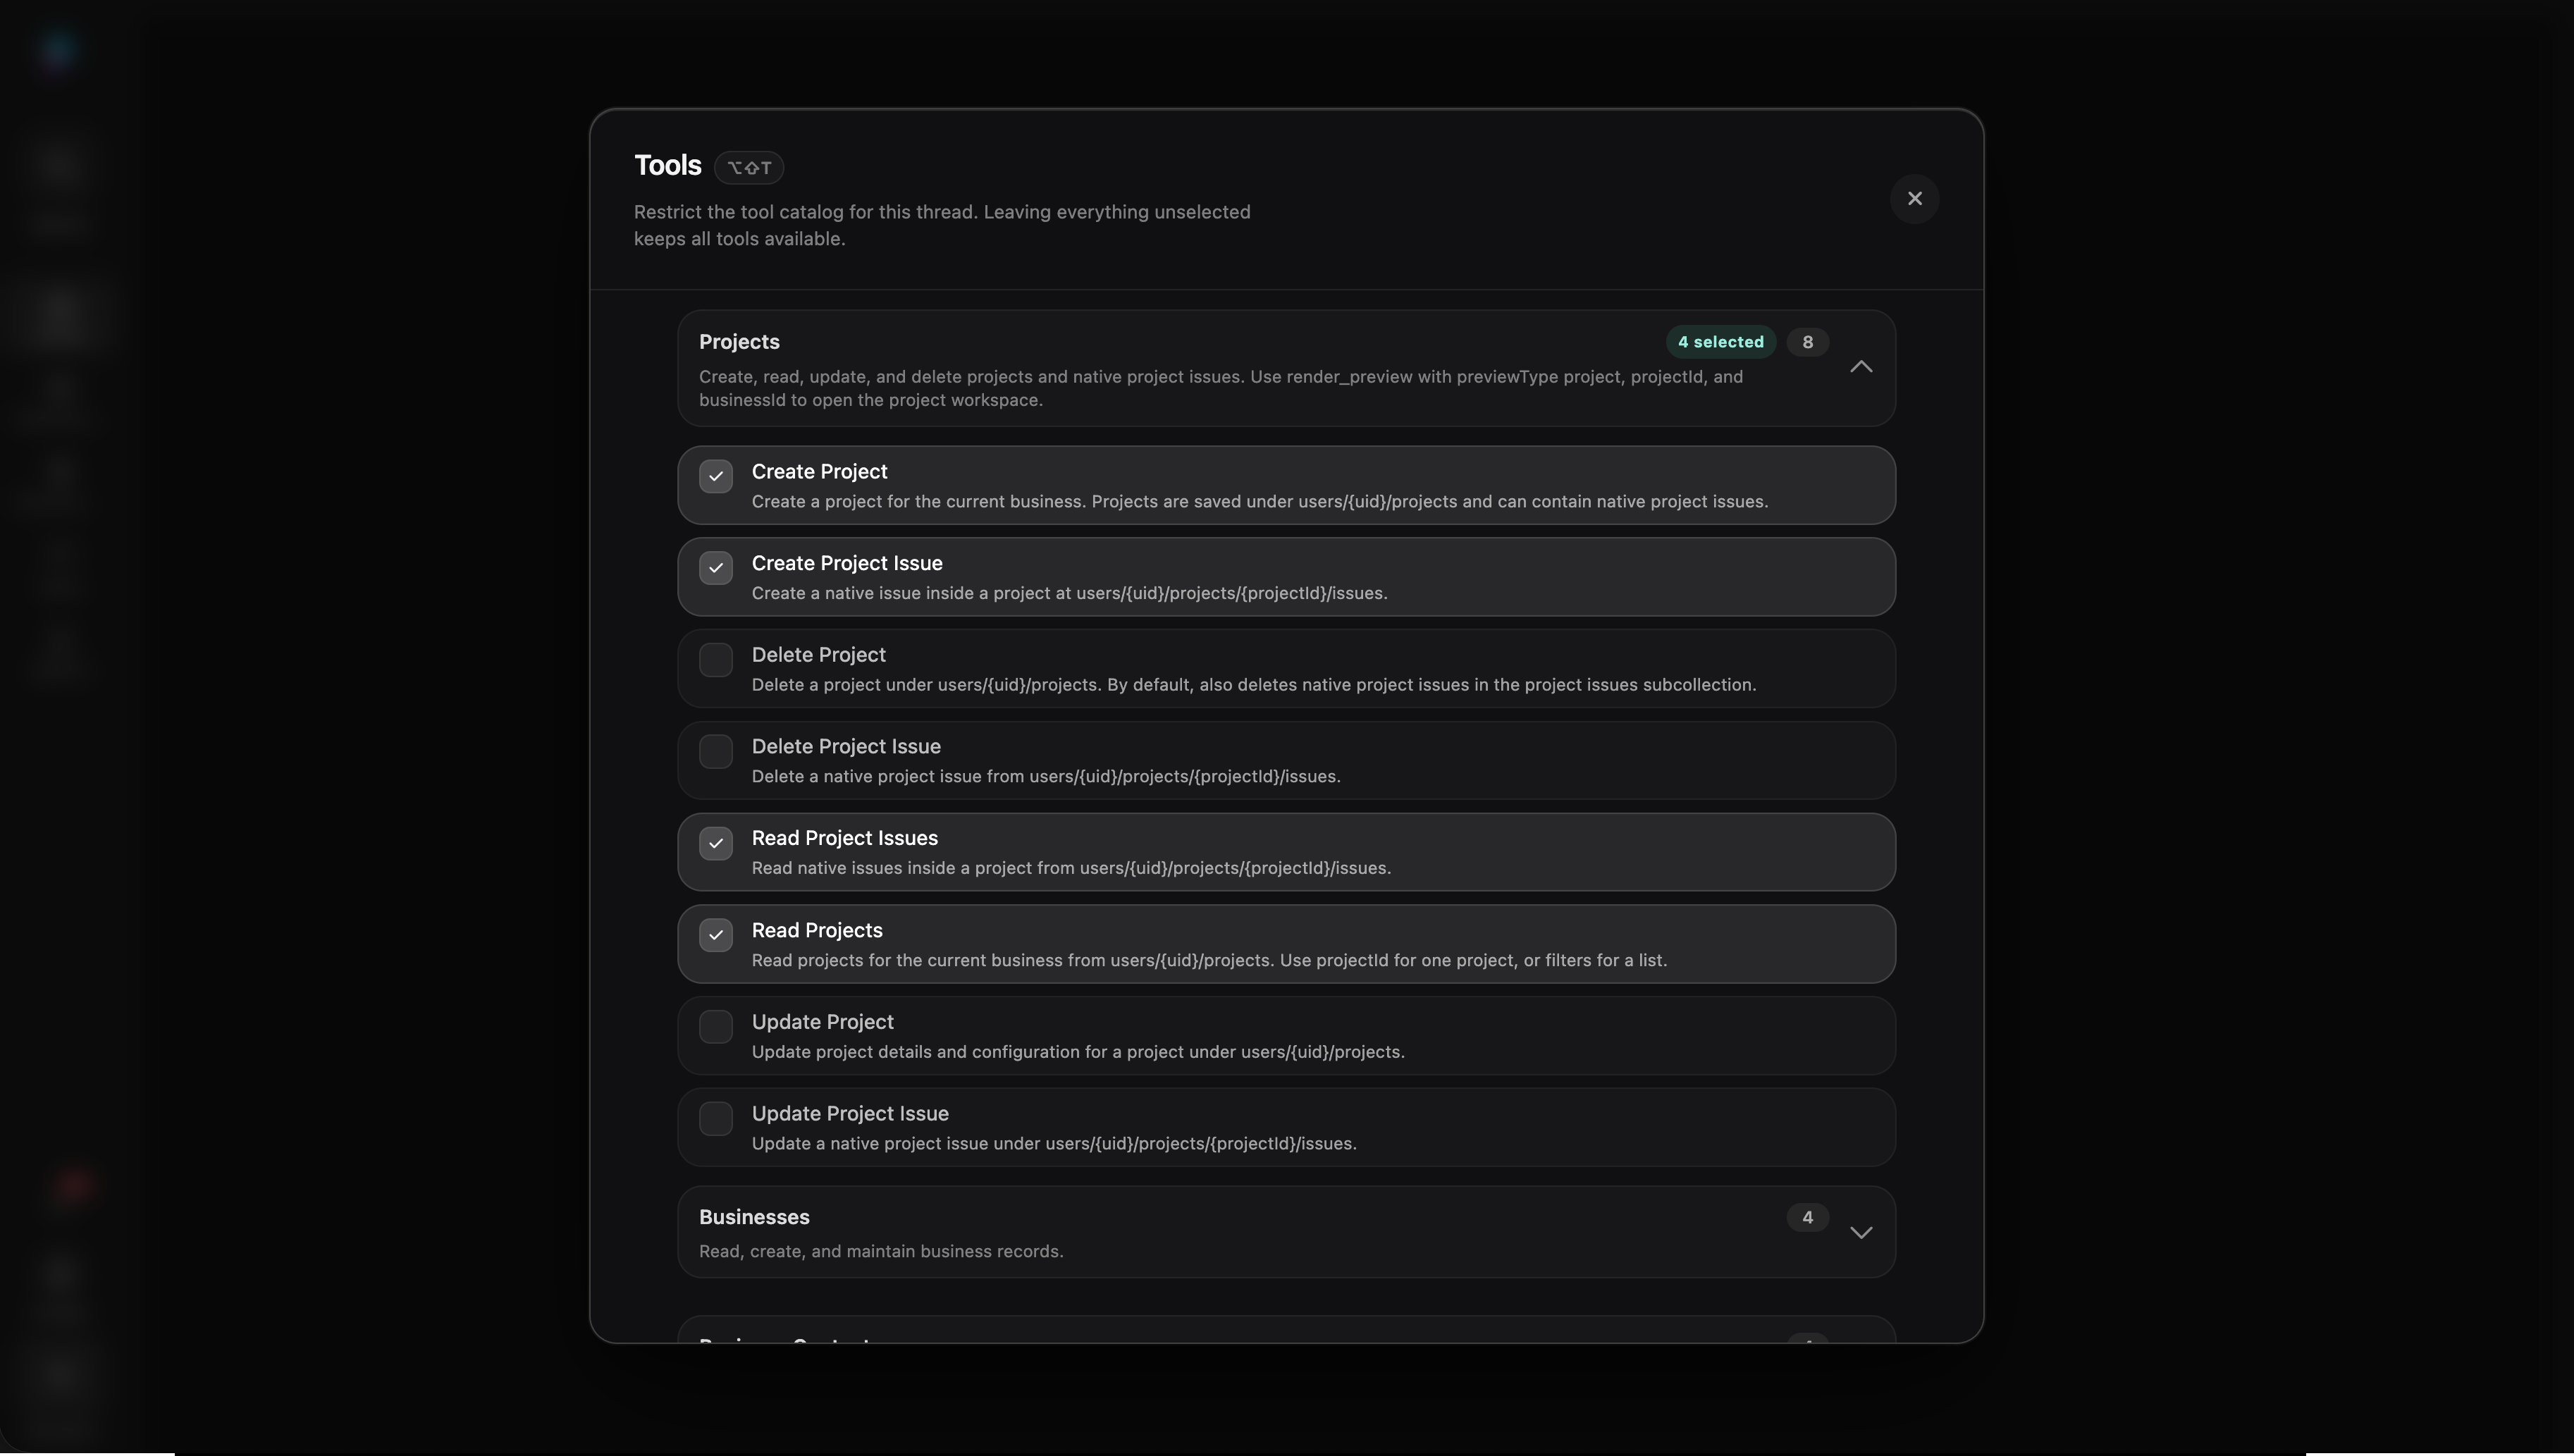
Tool selection defines what the agent can do
The process below is the operating model for those surfaces. Product traces become human labels. Labels become open and axial codes. Codes shape synthetic coverage. Reviewed rows become goldens. Goldens feed capability, regression, trajectory, and safety evals. Capability evals then inform agentic engineering: playbooks, tool contracts, goal controls, and handoff behaviour improve before the next run. Observability keeps the loop alive after release by turning production incidents into the next labelled cases.
flowchart TD
  subgraph Product["Product surfaces"]
    Single["Single-turn completions"]
    Multi["Multi-turn"]
    Agents["Multi-turn agents<br/>(tools)"]
  end

  subgraph Evidence["Trace evidence"]
    Runs["Production and staging runs"]
    Spans["Traces and spans<br/>prompt, playbook, model, tools, state, cost"]
  end

  subgraph Curation["Human curation"]
    Labels["Manual labels<br/>thumbs, stars, notes, golden flags"]
    Codes["Open codes to axial codes<br/>failure-mode taxonomy"]
  end

  subgraph Synthetic["Synthetic data"]
    SyntheticPlan["Synthetic coverage plan<br/>expand around failure modes"]
    SyntheticGenerate["Synthetic data creation<br/>CLI queries backend context"]
    SyntheticReview["Synthetic review<br/>discard weak or unrealistic rows"]
  end

  subgraph Dataset["Dataset lifecycle"]
    Fetch["CLI fetch<br/>labelled production traces"]
    Raw["Raw candidate rows<br/>gitignored"]
    GoldenReview["Golden curation<br/>dedupe, redact, set expectations"]
    Goldens["Committed goldens<br/>versioned .dataset.json"]
  end

  subgraph Suite["Eval suite"]
    Capability["Capability evals<br/>playbook first tier"]
    Regression["Regression evals<br/>known failures"]
    Trajectory["Trajectory evals<br/>tool path and goal loop"]
    Safety["Safety evals<br/>permissions, grounding, approvals"]
  end

  subgraph Engineering["Agentic engineering loop"]
    Gaps["Capability gaps<br/>what the workflow cannot yet do"]
    ProductionGaps["Production quality gaps<br/>observed failures and anomalies"]
    PlaybookWork["Improve playbooks<br/>instructions, fields, handoff"]
    ToolWork["Tighten tools<br/>schemas, permissions, affordances"]
    GoalWork["Goal controls<br/>subgoals, stop rules, escalation"]
    Fix["Fix prompt, playbook, tool, model route, UI, or policy"]
  end

  subgraph Release["Release path"]
    Local["Local runs"]
    PR["PR reports"]
    Gates["Selective CI gates"]
    Ship["Release"]
  end

  subgraph Observability["Observability loop"]
    Monitors["Online evals and monitors<br/>flags, retries, drift, incidents"]
    Observe["Observe dashboard<br/>quality inbox"]
    Incidents["Production incidents<br/>cost, latency, safety, tool-path anomalies"]
  end

  Single --> Runs
  Multi --> Runs
  Agents --> Runs
  Runs --> Spans
  Spans --> Labels
  Spans --> Monitors
  Labels --> Codes
  Codes --> SyntheticPlan
  SyntheticPlan --> SyntheticGenerate
  SyntheticGenerate --> SyntheticReview
  Labels --> Fetch
  Fetch --> Raw
  SyntheticReview --> Raw
  Raw --> GoldenReview
  GoldenReview --> Goldens
  Goldens --> Capability
  Goldens --> Regression
  Goldens --> Trajectory
  Goldens --> Safety
  Capability --> Gaps
  Gaps --> PlaybookWork
  Gaps --> ToolWork
  Gaps --> GoalWork
  ProductionGaps --> PlaybookWork
  ProductionGaps --> ToolWork
  ProductionGaps --> GoalWork
  ProductionGaps --> Fix
  PlaybookWork --> Runs
  ToolWork --> Runs
  GoalWork --> Runs
  Fix --> Runs
  Capability --> Local
  Regression --> PR
  Trajectory --> PR
  Safety --> Gates
  Local --> PR
  PR --> Gates
  Gates --> Ship
  Ship --> Runs
  Ship --> Monitors
  Monitors --> Observe
  Observe --> Incidents
  Observe --> Labels
  Incidents --> Labels
  Incidents --> ProductionGaps
This aligns with where the ecosystem is moving. OpenTelemetry GenAI semantic conventions are standardizing AI spans and metrics. OpenInference extends OpenTelemetry-style traces for LLM calls, agents, retrieval, and tool execution. Managed platforms from Confident AI, LangChain/LangSmith, and Arize/Phoenix increasingly provide end-to-end versions of this loop: tracing, datasets, experiments, evaluation, and observability in one place.
In Platfio, we built much of this directly into the platform because those managed solutions were still maturing while the product needed the loop immediately. The labelling UI, trace records, CLI fetch/generate/promote lifecycle, CI runs, and observability views were already attached to Platfio’s product state and agent engine. Pulling that out into a separate tool too early would have meant losing the product-specific context that made the evals useful.
The vendor can change. The operating model should not.
Contents
- Adding trace instrumentation
- Manual labels turn traces into datasets
- Open and axial codes
- Synthetic data expands coverage
- From annotation to eval run
- Goldens anchor the suite
- Types of evals
- The metric stack
- CI is a release system
- Observability closes the loop
- How this looked in Platfio
- The operating standard
The best eval systems behave like product feedback loops, not academic scoring projects. The loop above is the shape: product use creates evidence, evidence becomes review, review becomes datasets, datasets become evals, evals inform release, and observability sends production learning back to the start.
The loop is simple:
- Instrument the workflow.
- Collect traces.
- Review and annotate real failures.
- Convert representative cases into datasets.
- Run offline evals against proposed changes.
- Gate the risky changes in CI.
- Monitor sampled production traffic.
- Promote new failures into regression coverage.
The important part is the direction of travel. Production teaches the eval suite what matters. The eval suite protects production from repeating the same mistakes.
That is how evals avoid becoming theater. A suite full of synthetic happy paths will usually pass while the product remains unreliable. A suite grounded in real traces becomes a memory of what the product has already learned the hard way.
Adding trace instrumentation
Observability begins before the first eval.
If the trace only stores the user input and final answer, it is already too thin for serious debugging. A modern AI trace needs enough structure to explain the path, not only the result.
| Evidence | Why it matters |
|---|---|
| Input, attachments, and visible context | Shows what the system was actually asked to solve |
| Prompt and playbook version | Separates model failure from instruction or workflow failure |
| Model route and provider | Makes quality, latency, and cost comparable across routes |
| Retrieved documents and scores | Explains whether the system had the right evidence |
| Tool schemas, calls, arguments, and results | Reveals whether the agent acted correctly |
| State mutations and artifacts | Shows what changed in the product, not only what was said |
| Cost, tokens, latency, retries, and stop reason | Makes operational regressions visible |
| User, tenant, environment, release, and feature flags | Lets teams isolate blast radius without leaking sensitive data |
| Human feedback and review annotations | Turns production experience into learnable data |
This does not mean dumping raw private data into a dashboard forever. A good trace design includes redaction, masking, retention policy, tenant boundaries, and stable identifiers that are useful for debugging without being unnecessarily revealing.
The goal is not maximal logging. The goal is reconstructable behaviour.
A dataset is not just a CSV of prompts.
For LLM systems, a useful dataset is a curated set of examples with enough context to reproduce the decision the system had to make. For agentic systems, that may include the available tools, expected tool calls, expected state changes, prohibited actions, and the final user-visible response. For RAG, it may include the corpus version, expected source documents, retrieved context, and claims that must be grounded.
Good datasets usually come from four places:
| Source | Use |
|---|---|
| Production traces | Real user behaviour and real product edge cases |
| Human-curated examples | Important scenarios that are rare but high value |
| Regression cases | Failures that should never silently return |
| Synthetic variants | Coverage expansion around known shapes, languages, personas, or edge cases |
Synthetic data is useful, but it should not become the center of gravity too early. The product’s actual traces tell you where the system is failing in practice. Synthetic variants are best used to expand around those discovered risks.
Every dataset should also have ownership. If nobody knows which workflow a dataset protects, which release decisions it informs, or what should happen when it fails, it will decay.
Manual labels turn traces into datasets
Manual labelling is the part of the system that keeps evals attached to reality.
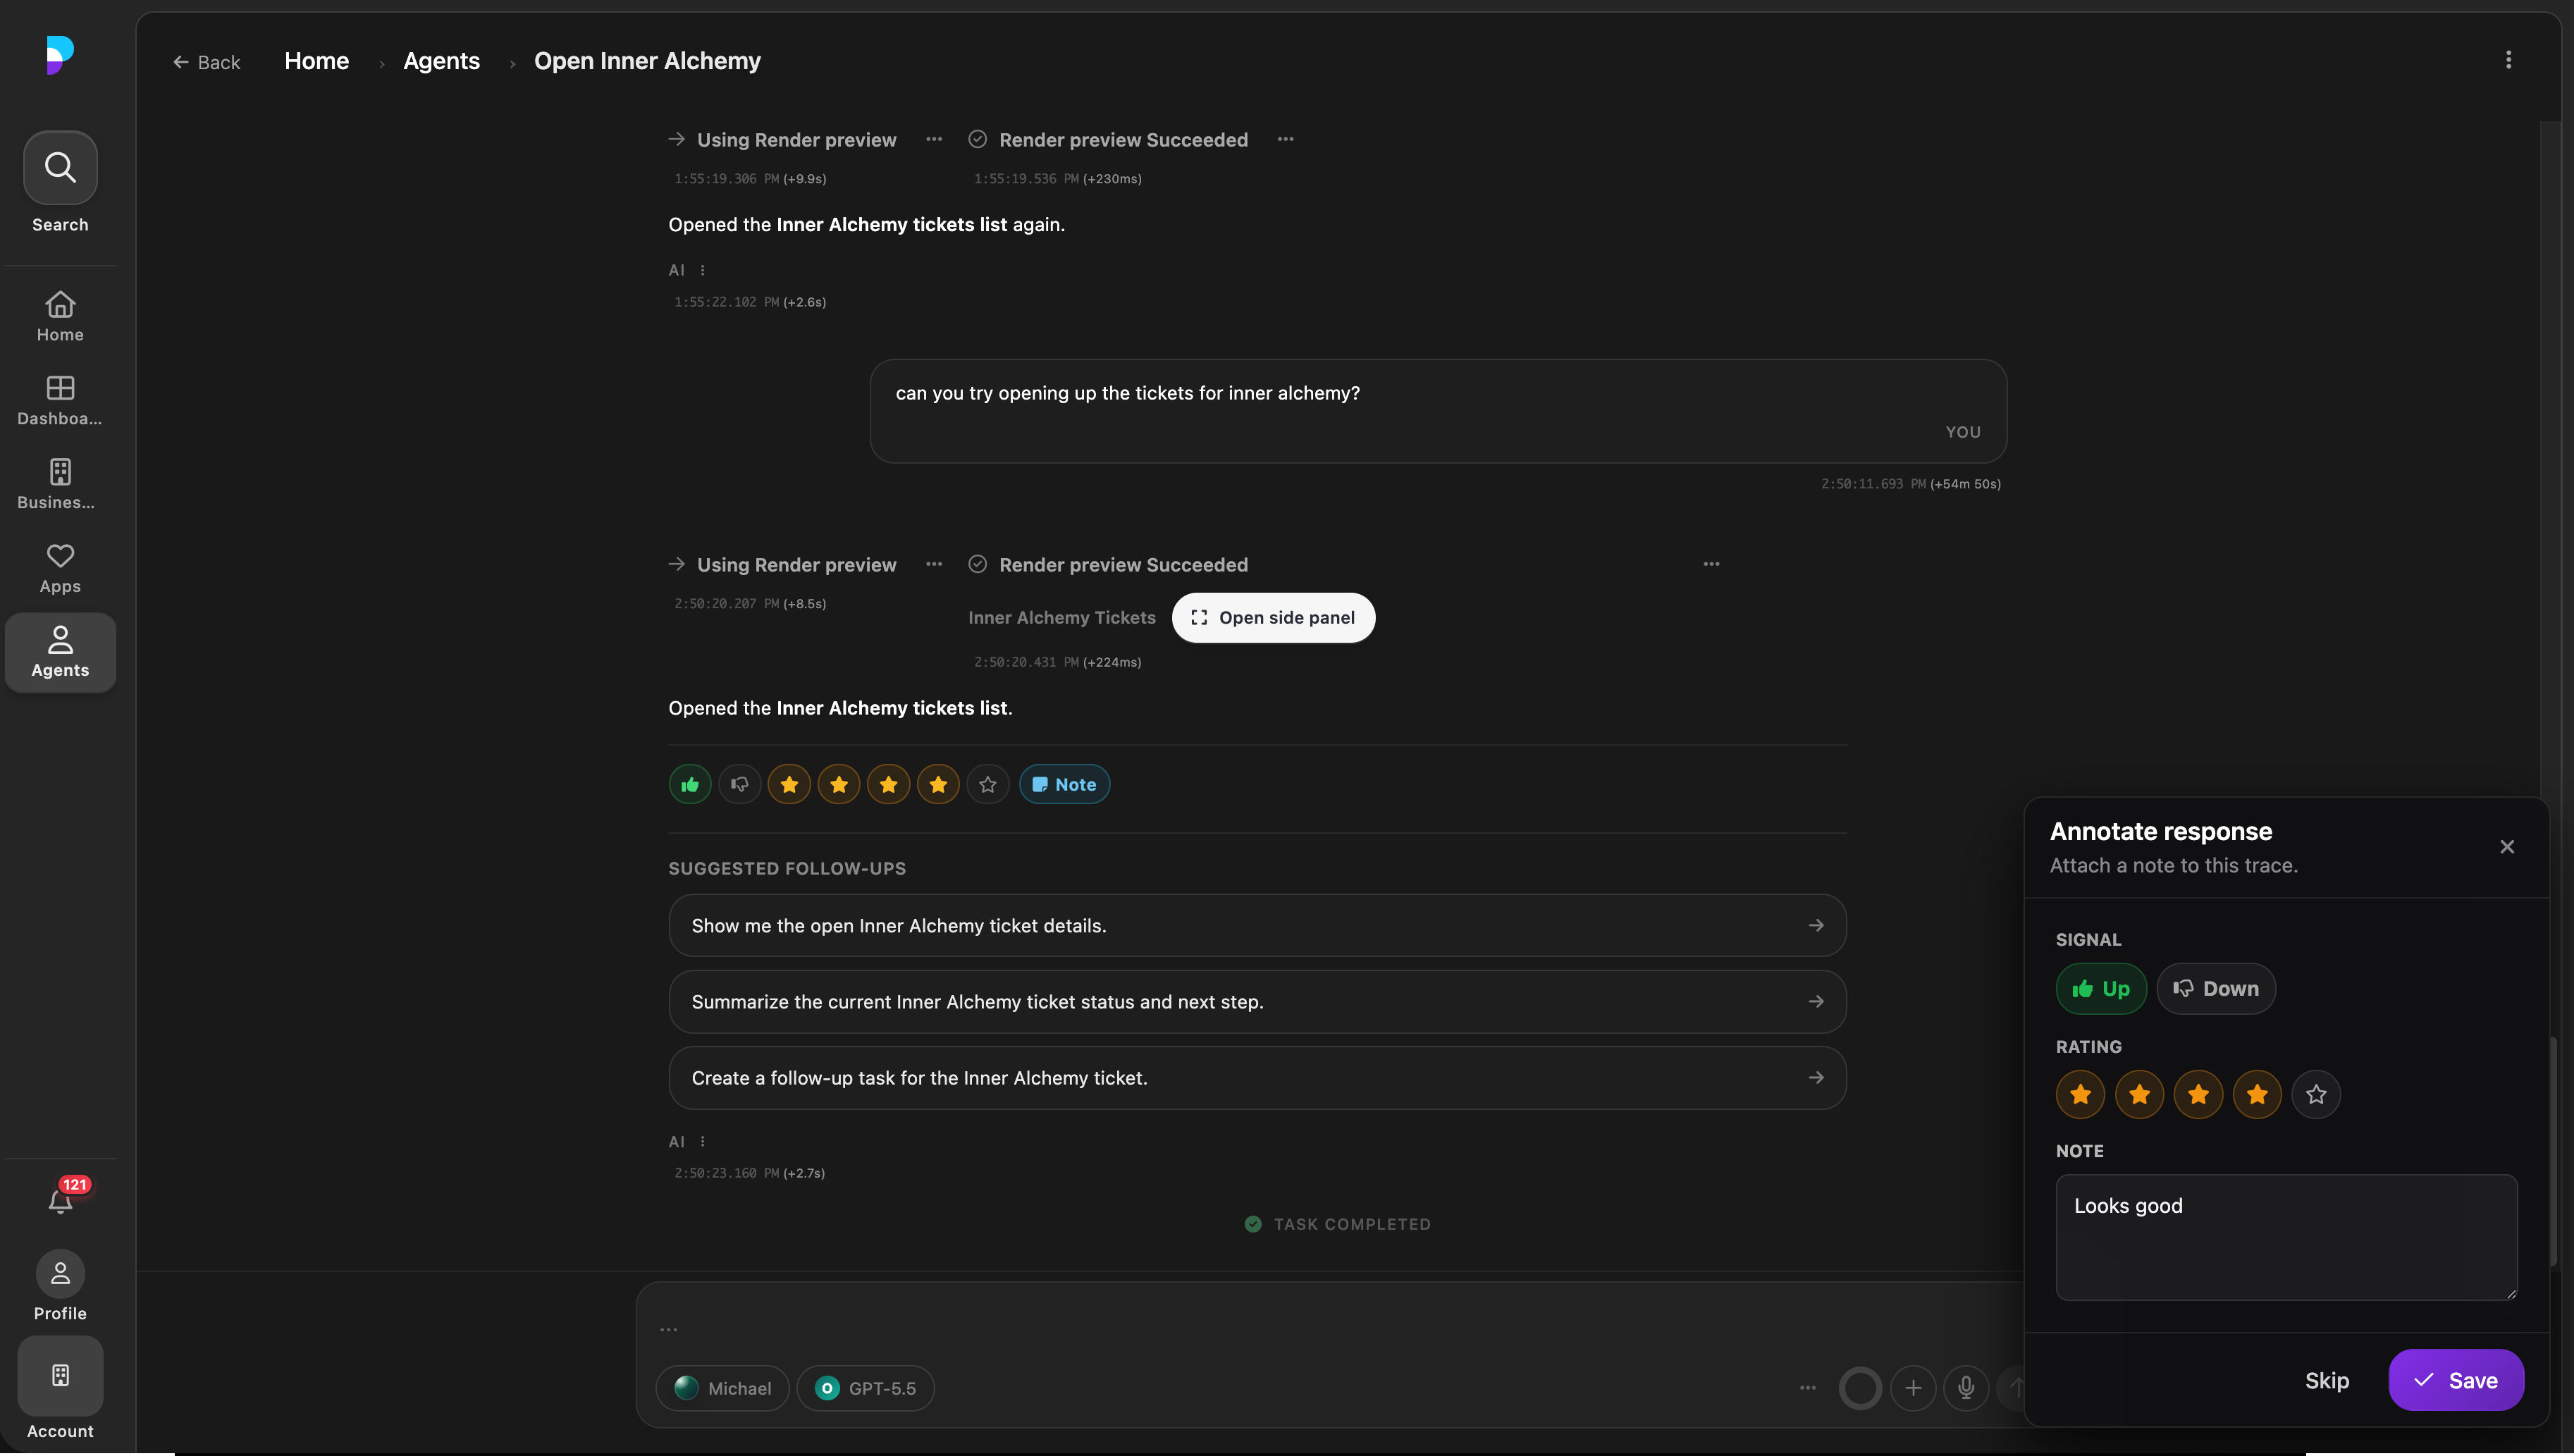
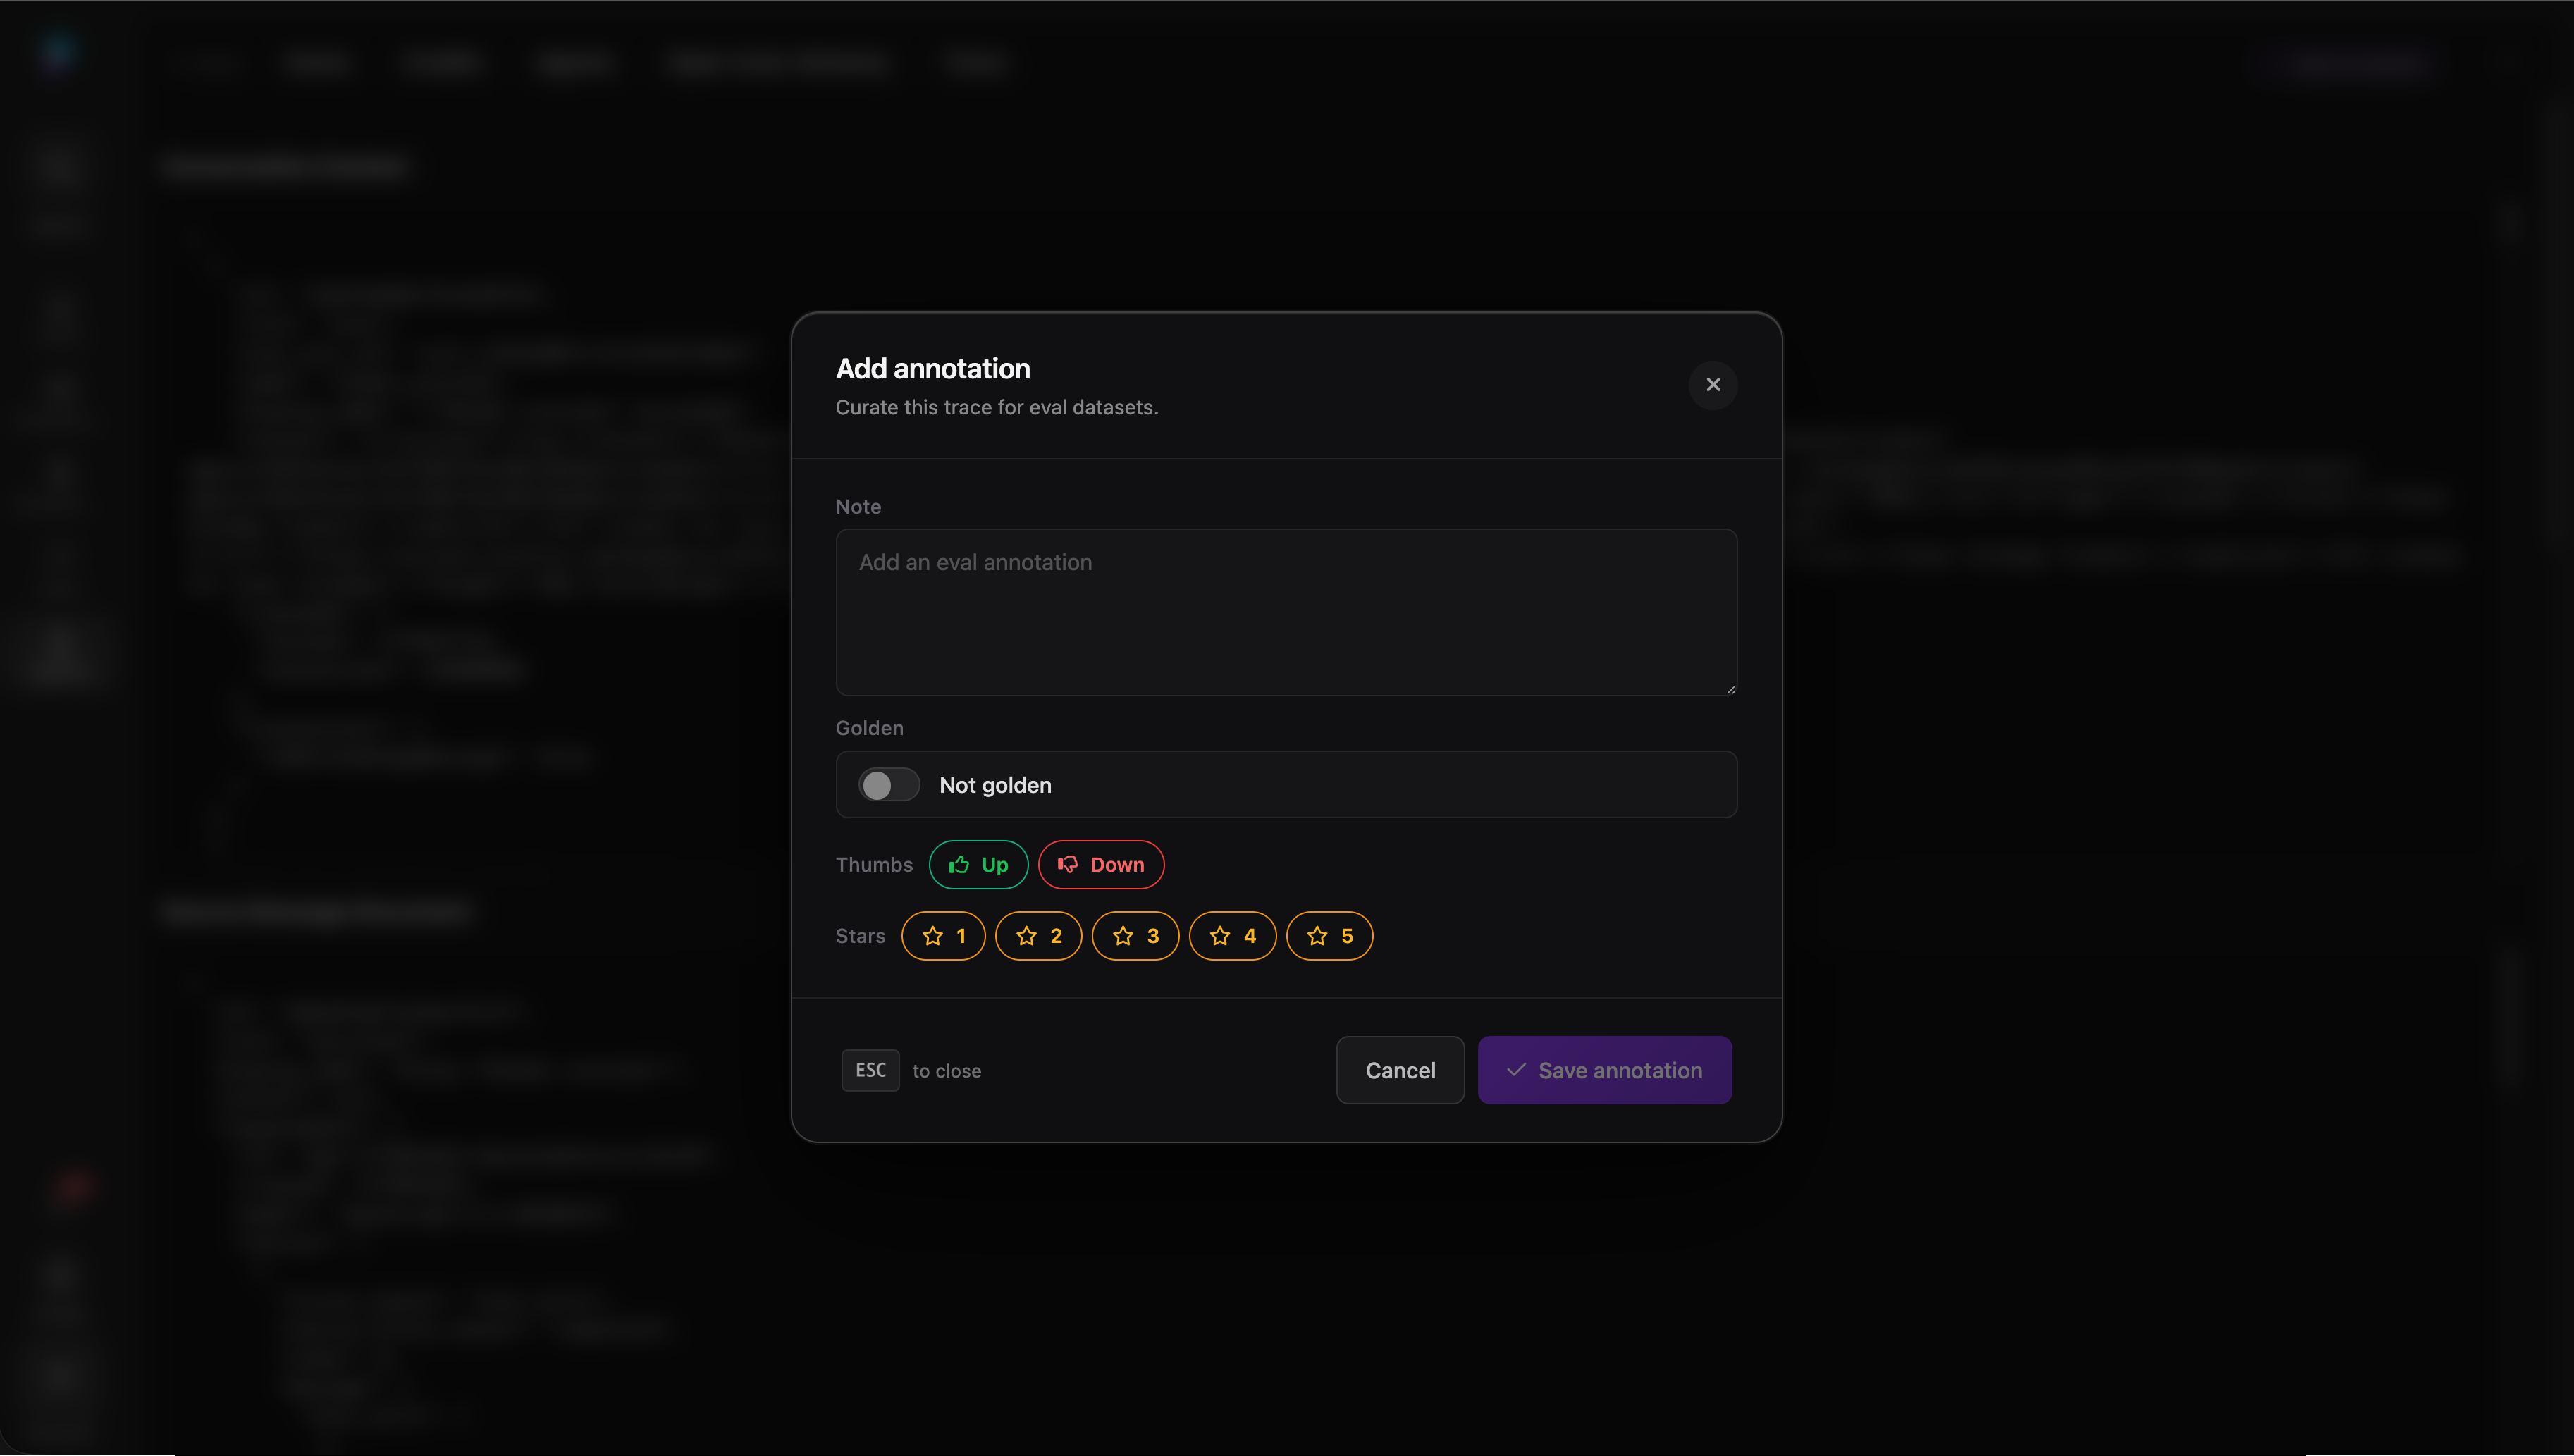
The important move is to make feedback available where the reviewer already has the evidence: the output, the trace, the tool path, the prompt context, and the product state. A thumbs-up, thumbs-down, star rating, note, or “golden” marker is not just product feedback. It is the raw material for future eval rows.
The best manual labelling UI is small but opinionated. It lets a reviewer mark whether the run was useful, rate quality, add a note, and promote a trace into a curated dataset when it represents behaviour the product should preserve. For agents, the reviewer also needs access to the raw trace because the final answer may hide the thing that actually matters: which tool was called, what arguments were passed, what state changed, and where the run drifted.
1. In-product feedback at the moment of review
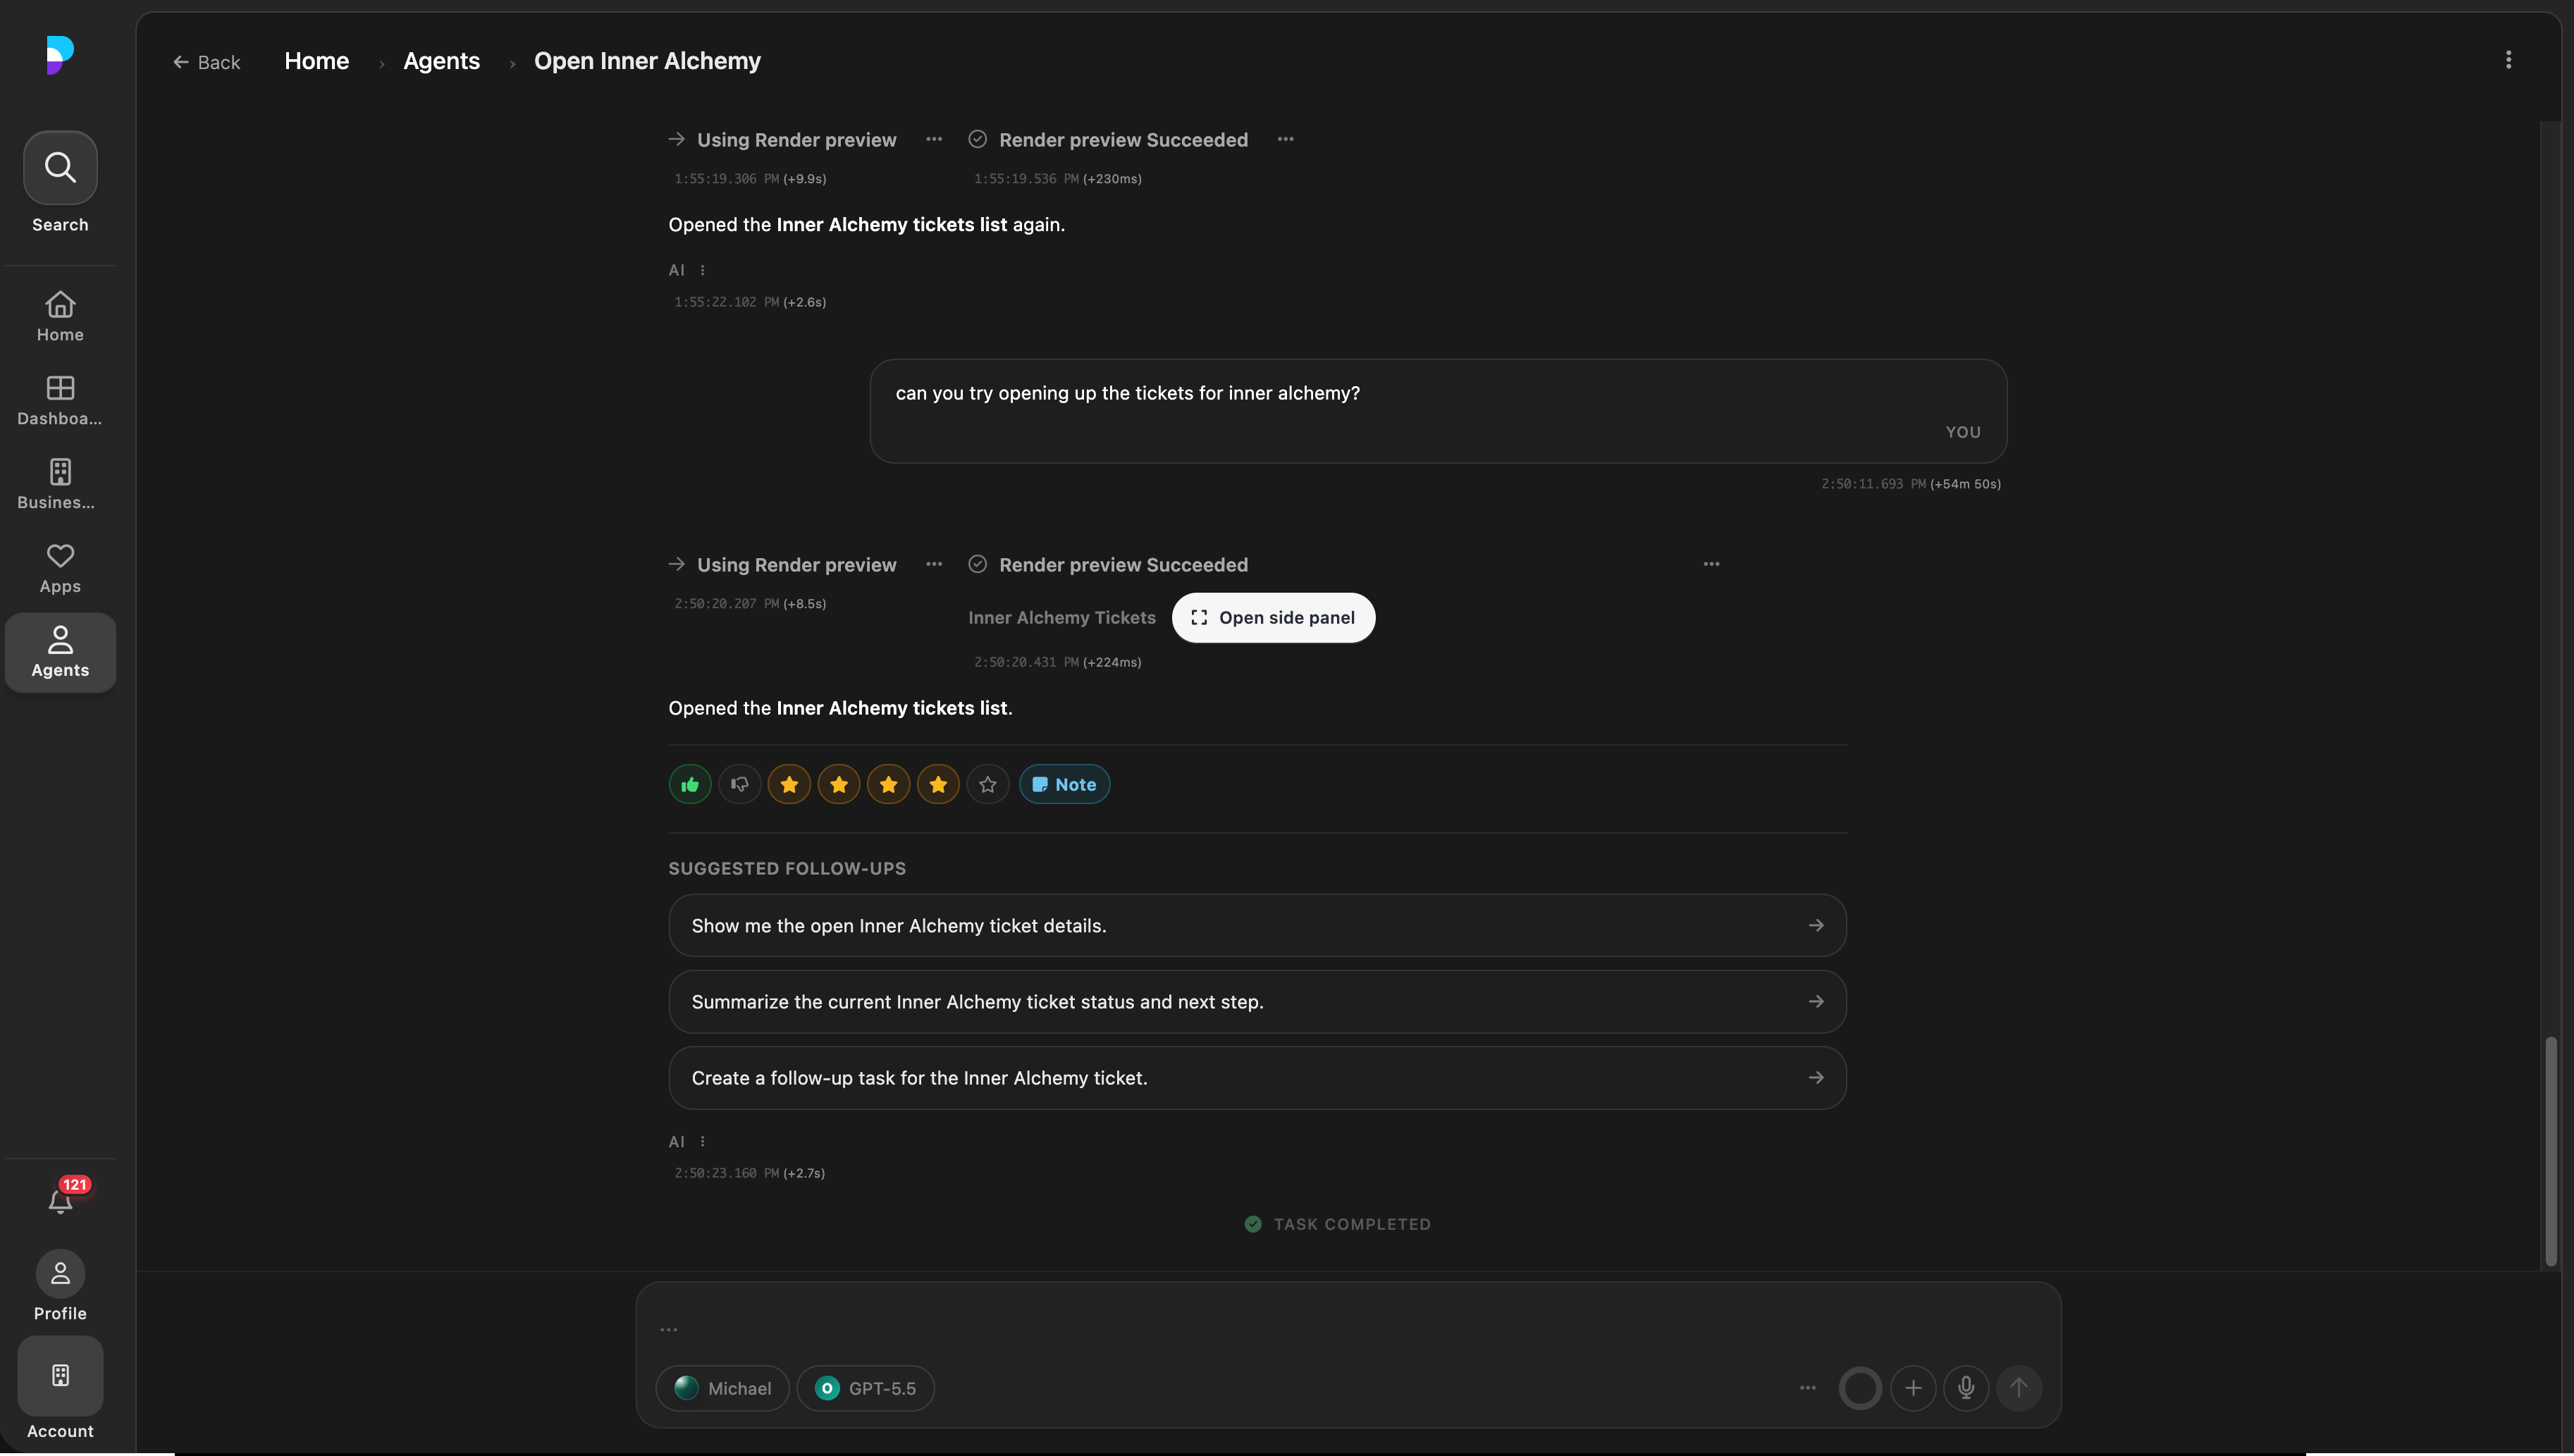
2. Staff curation promotes selected traces into eval candidates
3. Trace details preserve the evidence needed to replay and score the run
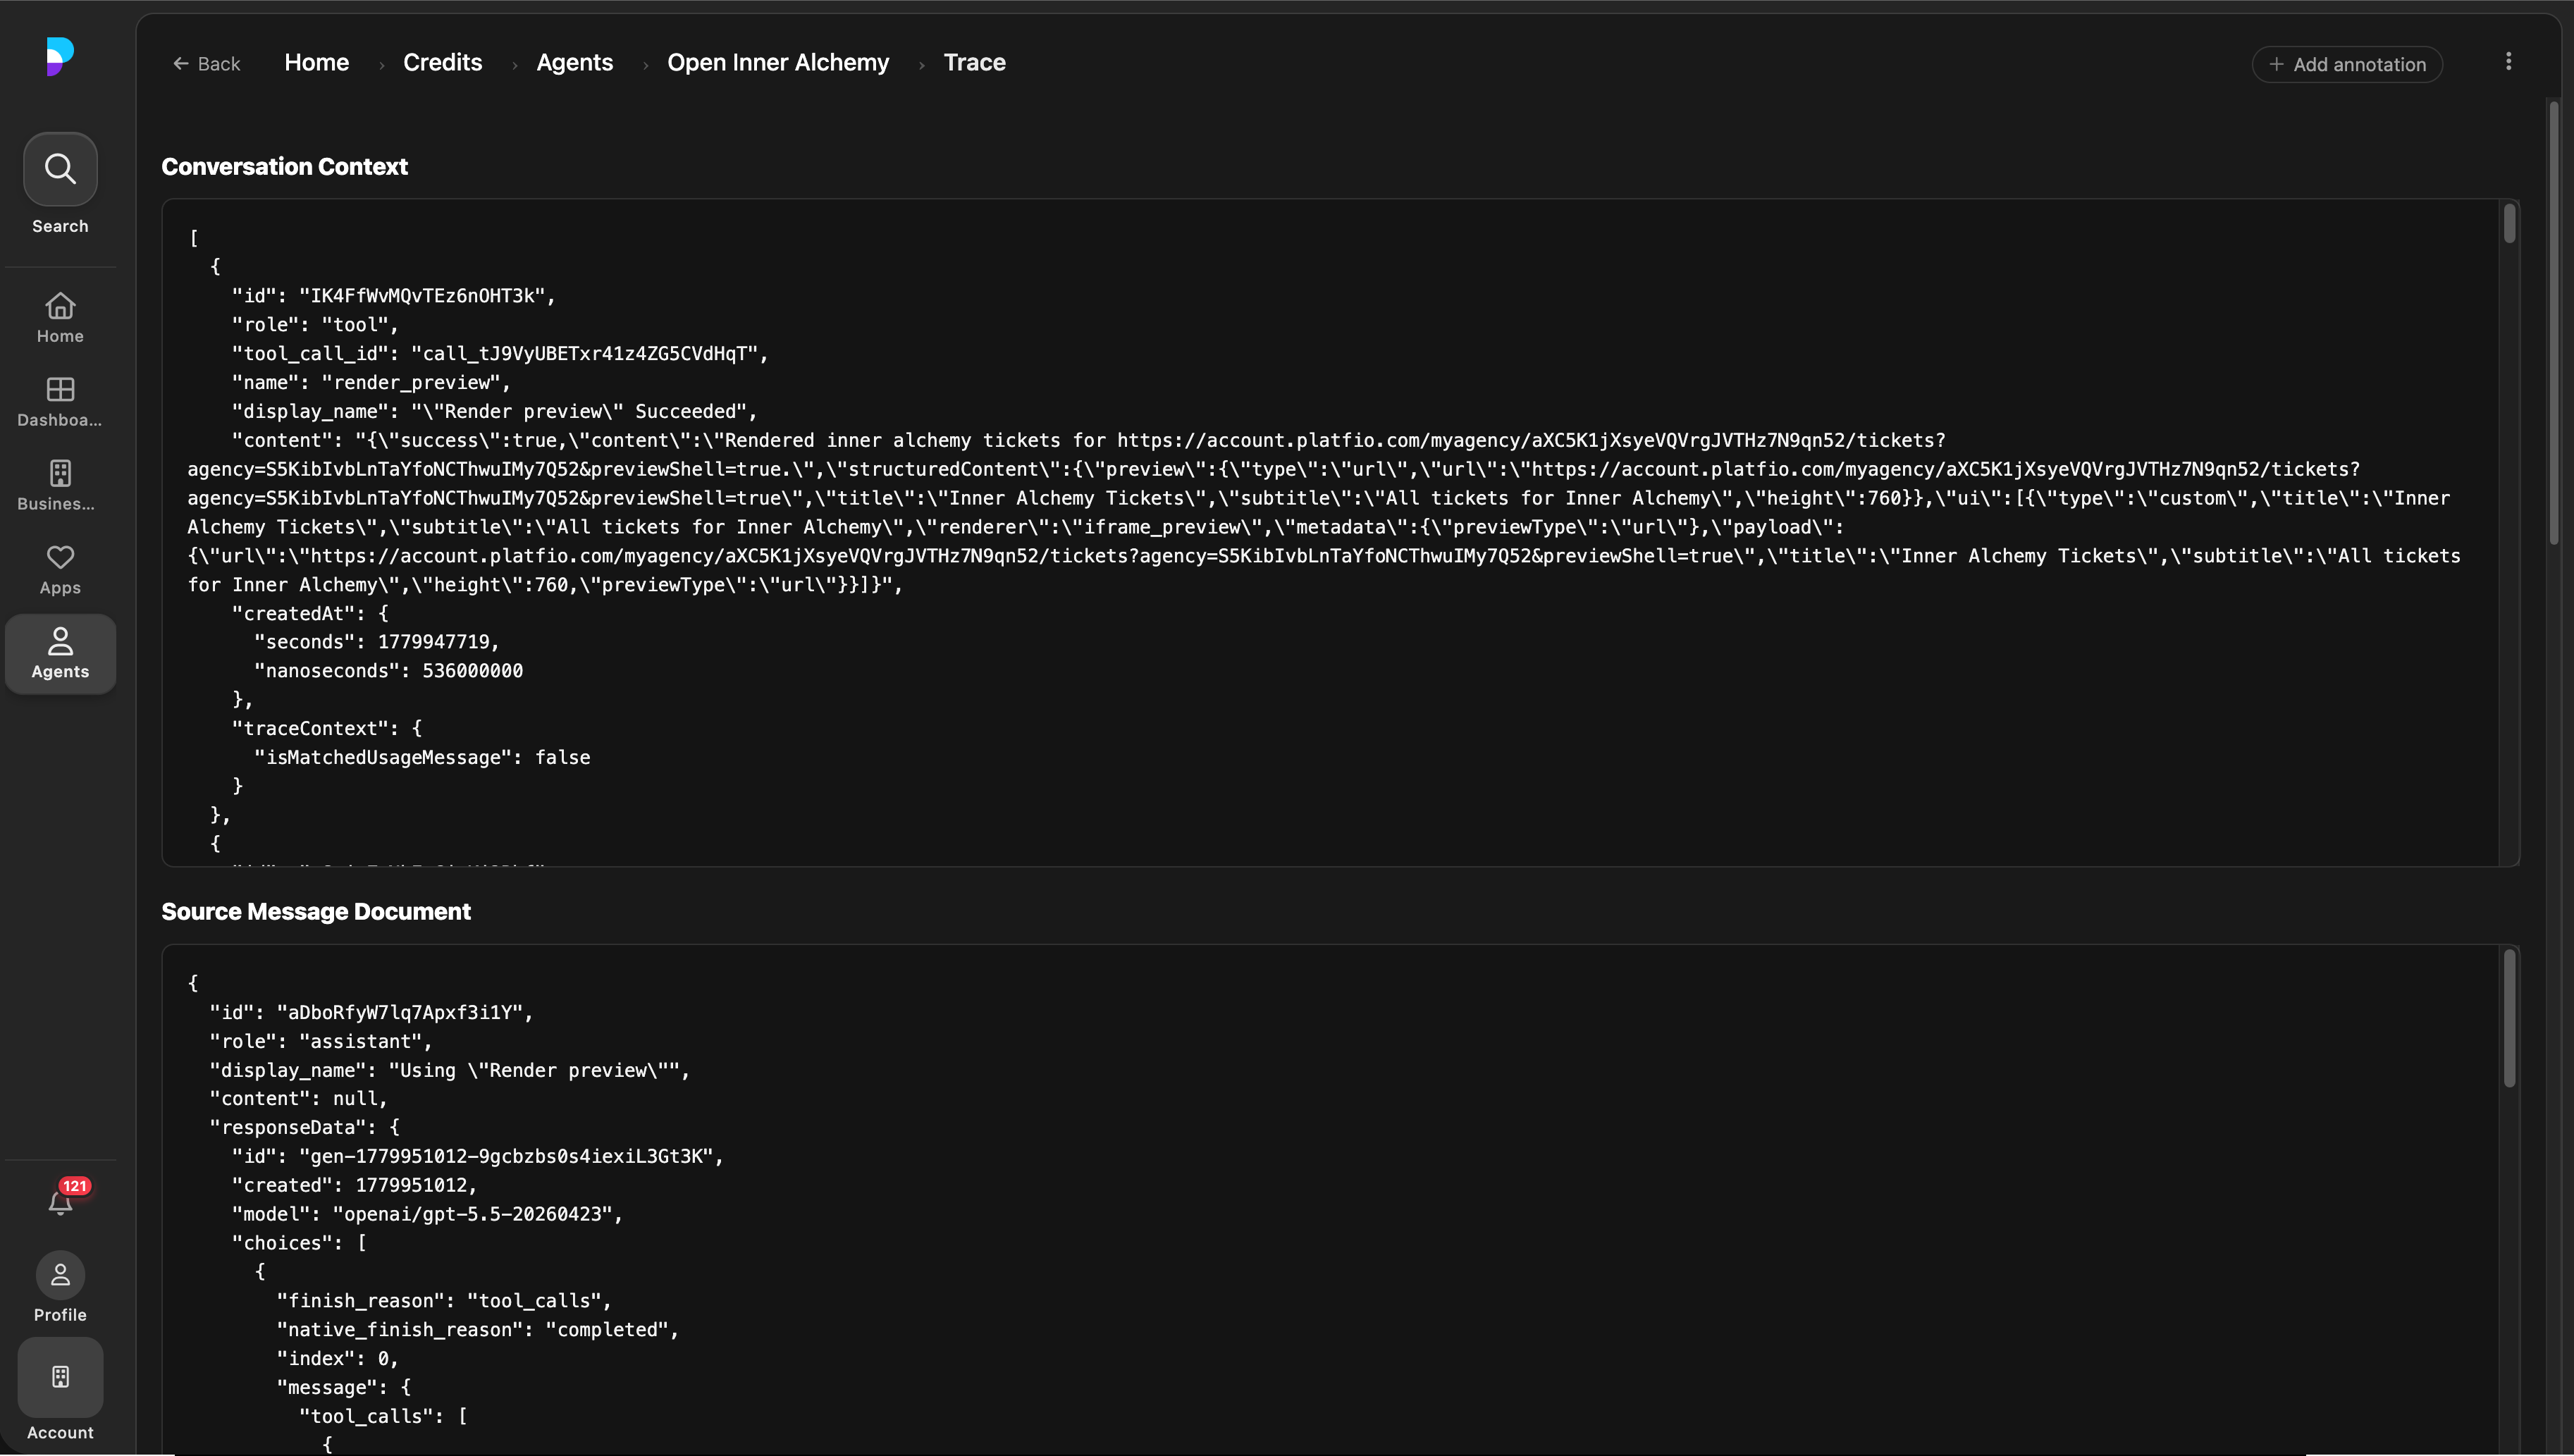
This is the difference between collecting reactions and building a learning system. A reaction says “this was good” or “this was bad.” A labelled trace says what happened, why it mattered, and which future release should keep passing that case.
Open and axial codes
Human-labelled traces are most useful before they become too tidy.
The first pass should use open codes: short, concrete labels that describe what the reviewer sees without forcing it into a pre-existing taxonomy. A reviewer might tag a trace as missed-user-constraint, wrong-tool, tool-success-user-cannot-see-result, unsupported-claim, weak-handoff, repeated-retry, or confusing-next-action.
Open codes preserve the texture of the failure. They are intentionally close to the evidence.
| Trace evidence | Possible open code |
|---|---|
| User says “wrong, that is not the app I meant” | wrong-entity |
| Agent calls a mutation tool before approval | premature-action |
| Tool succeeds, but the user still asks where the output is | invisible-result |
| Assistant gives a confident answer without source context | unsupported-claim |
| Final response says “done” but leaves no next action | empty-handoff |
The second pass is axial coding. Axial codes group open codes into higher-level patterns that explain what kind of system improvement is needed. This is where scattered labels become a failure-mode taxonomy.
| Axial code | Open codes it may group | Likely fix |
|---|---|---|
| Grounding failure | unsupported-claim, missing-source, stale-context | Retrieval, prompt, or citation eval |
| Tool-path failure | wrong-tool, premature-action, bad-arguments | Tool schema, permission, or trajectory eval |
| Product visibility failure | invisible-result, empty-handoff, unclear-next-action | UI state, artifact, or handoff design |
| Conversation control failure | missed-user-constraint, repeated-retry, lost-context | Multi-turn memory or recovery eval |
| Cost-quality failure | overpowered-model, retry-loop, slow-success | Routing, budget, or latency monitor |
This matters because raw annotations do not automatically tell you what to build. Open codes tell you what happened. Axial codes tell you what class of product quality problem it belongs to. Eval cases then protect the most important patterns.
In practice, I would not over-formalize this at the beginning. Start with human notes and open codes on traces. Periodically cluster them into axial codes. Promote only the patterns that recur, affect trust, or represent high-risk workflows. That keeps the eval suite grounded in lived product failures instead of someone’s imagined taxonomy.
Synthetic data expands coverage
Human-labelled traces tell you what has already happened. Synthetic data helps you explore what could happen next.
The useful version is not “ask a model for 100 random prompts.” It is backend-aware generation. The CLI can query the product backend, pull the relevant agency, plan, thread, playbook, or entity context, and then generate variations that still look like real Platfio workflows.
That means synthetic rows can be grounded in product state:
- Plan records with different levels of completeness.
- Agency contexts with different tool permissions.
- Conversations that start with onboarding, correction, or ambiguity.
- Proposal workflows with missing approvals, weak discovery, or edge-case constraints.
- Agent runs where tool access is available but should be restricted.
- Handoff scenarios with different next-action expectations.
The generation command should write into a gitignored generated-data area first, not straight into the committed dataset. Generated cases still need review. Some will be too easy, too weird, duplicated, or not representative of real product language.
python -m evals.cli.generate \
  --suite multi-turn \
  --feature who-are-you \
  --method scratch \
  --variation multi-turn \
  --num-goldens 30 \
  --scenario-context "Agency operators asking what the Platfio assistant can do" \
  --conversational-task "Explain capabilities and safe boundaries in Platfio" \
  --participant-roles "Agency operator and Platfio agency assistant"
I would use synthetic data for expansion, not invention. Start from open and axial codes, then generate around the important patterns:
| Axial code | Synthetic expansion |
|---|---|
| Grounding failure | Vary missing, stale, conflicting, and partial source context |
| Tool-path failure | Vary tool availability, permission boundaries, and approval timing |
| Product visibility failure | Vary whether the result appears as text, artifact, preview, or hidden state |
| Conversation control failure | Vary user corrections, ambiguous references, and mid-thread goal changes |
| Cost-quality failure | Vary task complexity and model route expectations |
This is also useful outside eval execution. Generated rows can test annotation UI, reviewer workflows, dataset promotion, prompt rubrics, dashboard filters, and observability queues before there is enough live traffic. The product can use synthetic traces to harden the whole quality system, not only the scoring step.
The rule is simple: synthetic data should widen the map around known terrain. It should not replace production traces as the source of truth.
From annotation to eval run
The annotation UI only matters if it connects to the engineering loop.
In Platfio, the useful shape was:
- A user or staff reviewer labels the run in the product UI.
- The label is stored against the completion or thread trace with the source record id, agency id, run type, note, rating, thumbs signal, golden flag, and reviewer context.
- The eval CLI fetches annotated traces from the database into gitignored raw rows.
- A reviewer promotes selected raw rows into the committed dataset for the right suite and feature.
- DeepEval runs the feature directory locally or in CI.
That created a clean boundary between product data and repo data. Production traces stayed in the database. Raw exports stayed local and gitignored. Only reviewed, intentionally promoted examples became committed eval cases.
python -m evals.cli.fetch \
  --type completions \
  --suite single-turn \
  --feature completion-plan-details \
  --agency-id AGENCY_ID \
  --golden-only \
  --limit 25

python -m evals.cli.promote \
  --suite single-turn \
  --feature completion-plan-details \
  --source evals/datasets/raw/single-turn/completion-plan-details/example.jsonl

deepeval test run evals/single-turn/completion-plan-details
For agent runs, the same pattern applied, but the row needed more than input and output. It needed the thread id, playbook id, model route, tool calls, tool results, artifacts, stop reason, and the final handoff. That is why multi-turn-agents lived in its own suite: the eval runner needed enough data to judge the path, not only the message.
The point is not that every labelled trace becomes a committed eval case. Most should not. The point is that when a human sees a run that is clearly good, clearly bad, or representative of an important edge case, there is a path from UI judgement to repeatable eval.
Goldens anchor the suite
Goldens are the examples the team deliberately chooses to preserve.
In a normal software test, the expected output is often obvious. In an AI workflow, the expected behaviour may include tone, groundedness, tool choice, omitted actions, handoff quality, or whether the assistant asked the right clarification question. That is why goldens should be reviewed artifacts, not just generated text.
There are two useful paths into goldens.
The first path is pulling reviewed production or staging traces down with the CLI. These are the strongest goldens because they came from real product use and a human marked them as worth preserving.
python -m evals.cli.fetch \
  --type completions \
  --suite single-turn \
  --feature completion-plan-details \
  --agency-id AGENCY_ID \
  --golden-only \
  --limit 25
The second path is generating candidate goldens with DeepEval. This is useful when the team needs broader coverage than production has produced so far: more variants, edge cases, personas, or conversation paths around a known failure mode.
python -m evals.cli.generate \
  --suite multi-turn \
  --feature who-are-you \
  --method scratch \
  --variation multi-turn \
  --num-goldens 30 \
  --scenario-context "Agency operators asking what the Platfio assistant can do" \
  --conversational-task "Explain capabilities and safe boundaries in Platfio" \
  --participant-roles "Agency operator and Platfio agency assistant"
Both paths should still flow through review and promotion. A fetched golden can be too specific, stale, or sensitive. A generated golden can be unrealistic. The committed dataset should contain cases the team is willing to defend.
python -m evals.cli.promote \
  --suite single-turn \
  --feature completion-plan-details \
  --source evals/datasets/raw/single-turn/completion-plan-details/example.jsonl
After promotion, the golden became ordinary repo evidence: generated or fetched, reviewed by a human, written into the feature’s .dataset.json, and committed with the prompt, metric, or tool change it protected. That is the point of calling them goldens. They are not ad hoc examples sitting in a notebook or local export; they are versioned expectations that CI can run again on every relevant change.
git add evals/single-turn/completion-plan-details/.dataset.json
git commit -m "test: add completion plan details goldens"
I would treat goldens as a small set of high-signal examples, not a warehouse. They should anchor the suite around behaviours that matter: known regressions, representative success cases, high-risk edge cases, and workflows where model or prompt changes are likely to break user trust.
Types of evals
The suite should name what kind of confidence each eval is trying to create.
Different eval types answer different engineering questions:
| Eval type | Question it answers | Typical signal |
|---|---|---|
| Capability eval | Can the system perform the workflow under realistic conditions? | Success across representative variants |
| Regression eval | Did a previously fixed or observed failure come back? | Exact case stays passing after prompt, model, tool, or code changes |
| Trajectory eval | Did the agent take the right path, not just produce a plausible final answer? | Correct playbook, tool choice, arguments, state transition, and recovery path |
| Safety eval | Did the system avoid unsafe, unauthorized, misleading, or policy-breaking behaviour? | Refusals, permission checks, grounded claims, approval gates, and safe handoff |
These are not competing categories. A single workflow can need all four. For example, a proposal-generation agent needs a capability eval to prove it can create a useful proposal, regression evals for known failures, trajectory evals for tool use and state mutation, and safety evals for permissions, unsupported claims, and approval boundaries.
The cleanest habit is to tag eval cases by type and failure mode. That makes the suite easier to reason about in CI. A failing capability eval says “this workflow may not work.” A failing regression eval says “we relearned an old lesson.” A failing trajectory eval says “the path is wrong even if the answer looks fine.” A failing safety eval says “do not ship until a human understands the risk.”
Playbooks anchor the first tier
One principle for eval design is to be precise about the unit under test.
In Platfio, the first useful unit was not the raw model and it was not a generic chat prompt. It was the playbook: a structured prompt product that packaged a common workflow, dynamic fields, recommended model route, available tools, output expectations, and handoff posture.
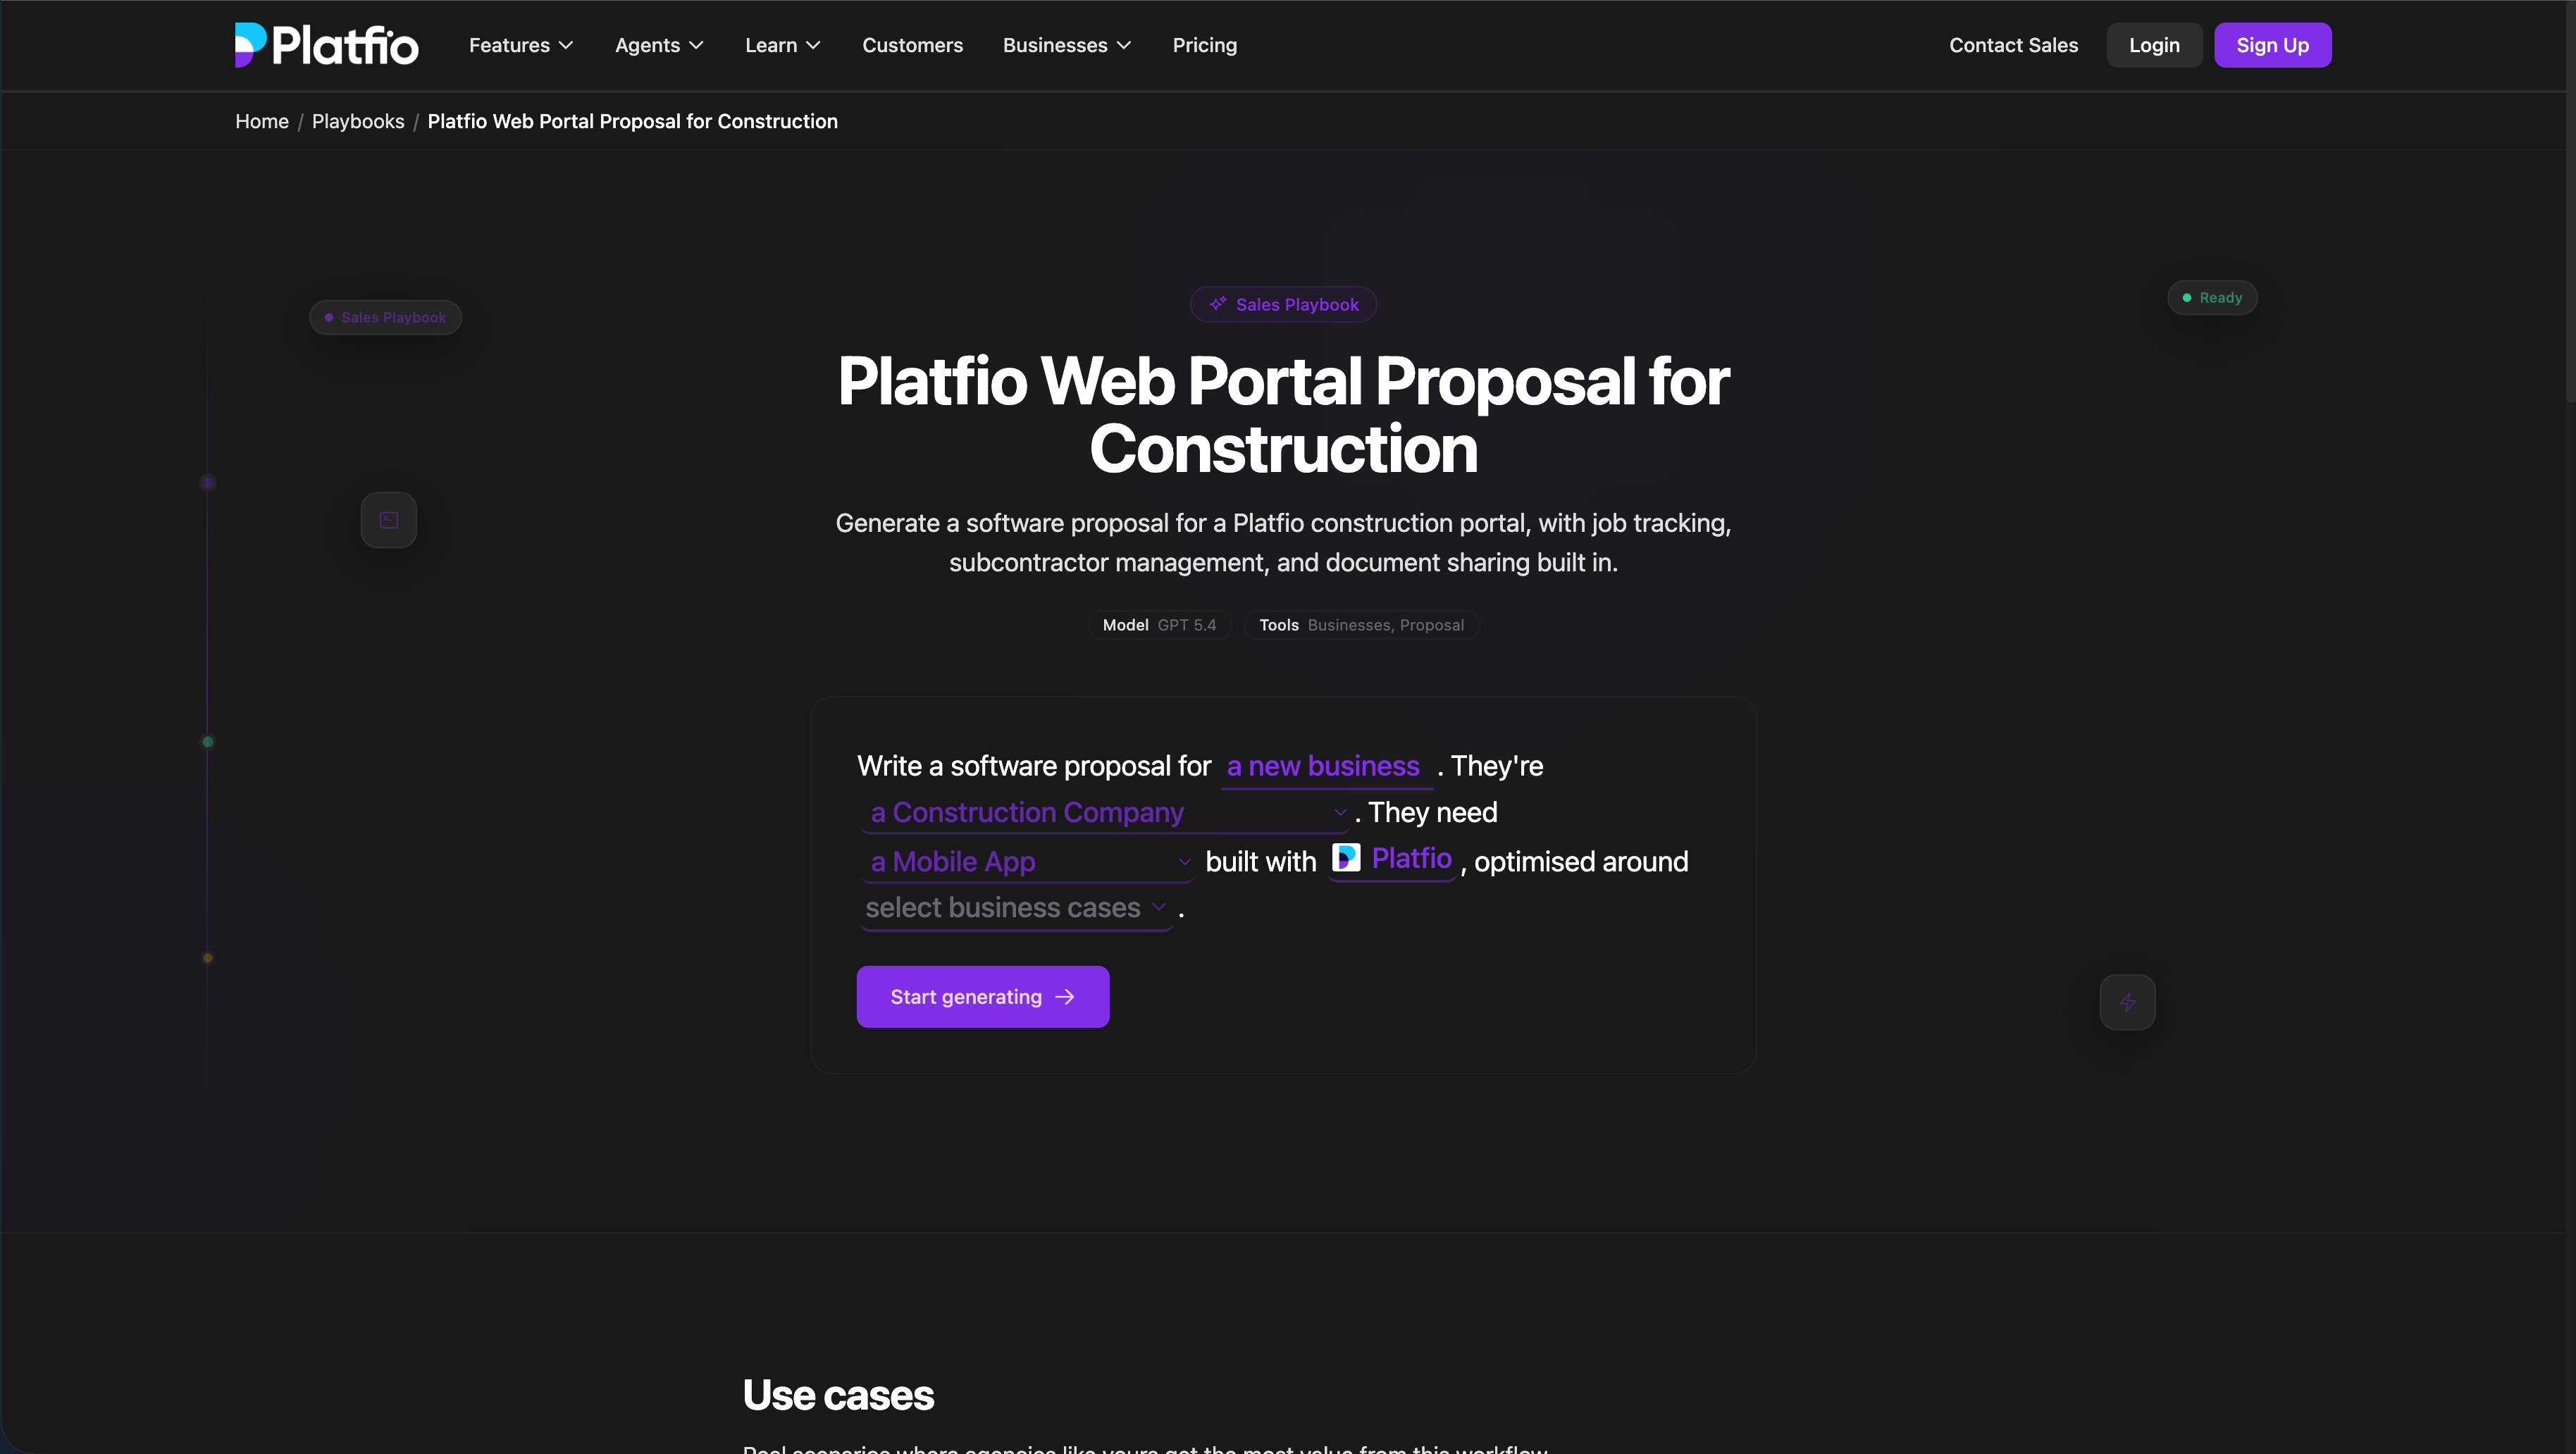
That gave the eval suite a sensible first tier. Before testing broad, messy user behaviour, each important playbook should prove it can perform its core job under realistic but bounded conditions.
| Tier | Unit under test | What it protects |
|---|---|---|
| First tier | A named playbook and its expected workflow contract | Common, high-volume use cases with structured inputs, allowed tools, and known output expectations |
| Second tier | Open-ended conversations and agent runs across playbooks | Ambiguous requests, mid-thread corrections, tool access changes, recovery, and user behaviour that does not fit the happy path |
This matters because playbooks are where product intent becomes executable. A proposal playbook, support handoff playbook, screenshot QA playbook, or code-review playbook can be tested like a product capability: does it ask for the right missing fields, use the right tools, preserve approvals, produce a usable artifact, and hand off cleanly?
The more unstructured tier should build on top of that. Once the playbook contract is stable, multi-turn and agentic evals can test whether the system chooses the right playbook, switches modes safely, recovers from corrections, respects goal controls, and avoids unsafe tool paths when the user does something less predictable.
The metric stack
There is no single LLM quality metric.
Modern practice is layered. Use the cheapest, most deterministic evaluator that can answer the question. Use LLM-as-judge when the judgement is semantic, nuanced, or qualitative. Use human review where the stakes are high or the rubric is still being learned.
| Layer | Best for | Examples |
|---|---|---|
| Code checks | Mechanical contracts | JSON schema, required fields, tool allowlists, no forbidden action |
| Exact or fuzzy match | Stable expected outputs | Classification labels, routing decisions, extracted identifiers |
| Retrieval metrics | RAG evidence quality | Context recall, context precision, source coverage |
| LLM-as-judge | Semantic quality | Faithfulness, helpfulness, policy compliance, handoff usefulness |
| Pairwise comparison | Product iteration | New prompt vs old prompt, model A vs model B |
| Human review | Ambiguous or high-stakes judgement | Safety, brand risk, customer-facing workflow acceptance |
| Operational metrics | Reliability and cost | Latency, error rate, retry rate, tool failure rate, token spend |
The most mature teams do not ask one metric to carry the whole product. They map failure modes to evaluators.
Unsupported claims need faithfulness checks and retrieval evidence. Unsafe refunds need tool and policy checks. Vague support triage needs handoff-quality rubrics. A malformed proposal needs deterministic schema and rendering checks. A correct but expensive workflow needs cost and latency monitors.
The metric should point to the fix.
Agentic evals are trajectory evals
Agentic evals are harder because the final answer can look fine while the hidden path is wrong.
An agent can:
- Select the wrong playbook.
- Skip discovery.
- Call a tool before approval.
- Use the right tool with unsafe arguments.
- Mutate the wrong record.
- Retry a failing action without changing conditions.
- Ignore a cheaper or safer route.
- Produce a final summary that hides an operational failure.
So an agentic eval needs to inspect the trajectory.
| Agentic target | What to evaluate |
|---|---|
| Task completion | Did the workflow actually reach the user’s objective? |
| Tool selection | Did the agent choose the right capability for the job? |
| Tool arguments | Were IDs, scopes, permissions, and business fields correct? |
| Tool timing | Did the agent ask, verify, or wait before consequential actions? |
| Recovery | Did failures lead to narrower attempts, escalation, or handoff? |
| State mutation | Did the product state change exactly as intended? |
| Handoff | Can the next human understand what happened and what remains? |
This is why agent traces need tool call IDs, arguments, results, available tool schemas, state snapshots, and artifact references. Without those fields, the eval can only judge the transcript. That is not enough.
For agents, the unit under test is not “the prompt.” It is the workflow: playbook, prompt layers, tool surface, retrieval, model route, permissions, product state, and output contract together.
This is also where goal controls matter. An agentic loop should expose enough goal state to be evaluated: the user’s objective, current subgoal, stop condition, allowed actions, escalation threshold, and reason for continuing or stopping. When a trace shows the loop drifting, retrying blindly, using the wrong tool, or stopping before the goal is satisfied, that failure should become a regression eval. The fix is then not only “change the prompt”; it may be to tighten the goal controller, add a stop condition, narrow the tool policy, require confirmation, or teach the loop to recover differently. Regression evals become the memory that improves the agent’s control loop over time.
RAG needs its own evidence
RAG systems fail in ways that normal completion evals miss.
The answer can be fluent and wrong because the retriever missed the right document. The retriever can find the right document and the generator can ignore it. The answer can be grounded in a stale document. The system can cite the correct source while smuggling in an unsupported claim.
A serious RAG trace should store:
- Query and rewritten queries.
- Corpus and embedding version.
- Retrieved document IDs, chunks, scores, and filters.
- Reranker inputs and outputs.
- Final context passed to the model.
- Claims in the answer that require grounding.
- Citations or source references shown to the user.
The eval suite should then separate retrieval failure from generation failure. Context recall, context precision, faithfulness, answer relevance, citation accuracy, and freshness are different questions. Blending them into one “answer quality” score makes debugging slower.
If the retriever never found the policy, do not tune the final prompt first. If the retrieved context was correct but the answer invented a refund rule, do not blame the vector database first.
LLM judges need calibration
LLM-as-judge is useful, but it is not magic.
A judge is another AI system. It has prompt sensitivity, model drift, positional bias, leniency, overconfidence, and failure modes of its own. Treat it like production logic.
A strong judge setup has:
- A clear rubric with pass, fail, and partial-credit criteria.
- Examples of good, bad, and borderline outputs.
- A calibration set scored by humans.
- Periodic agreement checks between judge and human reviewers.
- Reasons attached to scores so failures are debuggable.
- Different thresholds for advisory, warning, and blocking signals.
- Versioned judge prompts and judge models.
The judge should not decide everything alone. For mechanical contracts, code is better. For release-blocking safety decisions, humans may still be required. For broad semantic regression detection, a calibrated judge can be very effective.
The goal is not to remove judgement. It is to make judgement repeatable enough that engineering teams can use it.
CI is a release system
CI evals should start as visibility before they become authority.
The anti-pattern is to add a flaky eval suite, block every PR, and teach the team to ignore or bypass it. The better path is staged:
| Stage | Behaviour |
|---|---|
| Local runs | Developers can run a small suite before changing prompts, tools, or model routes |
| PR reports | Every relevant change produces comparable experiment results |
| Selective gates | Only trusted, critical checks block release |
| Release comparison | New prompt/model/tool versions are compared against the current baseline |
| Regression promotion | Production failures become new CI cases |
Not every eval should block. Some should warn. Some should annotate. Some should produce a report that a human reviews before a risky release.
The mature question is not “did the eval pass?” It is “what release decision should this evidence change?”
Observability closes the loop
Offline evals protect known cases. Observability discovers what changed in the world.
Production traffic drifts. Users find new prompts. A model provider changes behaviour. Retrieval quality decays as content changes. Tool errors spike after an API update. Costs creep because retries become common. A new customer segment uses the product differently than the original dataset assumed.
Observability monitors should watch for:
- Quality drops on sampled traces.
- Safety or policy violations.
- Retrieval miss patterns.
- Tool error and retry rates.
- Cost and latency regressions.
- Model route degradation.
- User thumbs-down or correction patterns.
- Drift by tenant, workflow, language, region, or release.
Observability does not need to judge everything. Sampling is often the right tradeoff. High-risk workflows can get heavier review. Low-risk workflows can use lighter monitors. The important thing is that production observations flow back into the dataset and release process.
The missing observability layer is the product’s early-warning system. It should not wait for a polished human annotation. It should raise a lightweight quality event whenever the live interaction suggests the user is confused, angry, blocked, or correcting the assistant.
One practical version is phrase-based observability. It is deliberately low tech:
| Signal | Example phrases | Observability action |
|---|---|---|
| User correction | ”wrong”, “that’s not right”, “not what I asked” | Attach the trace to a correction queue |
| User frustration | ”you’re stupid”, “this is useless”, “you broke it” | Raise severity and mark for staff review |
| Repeated failure | ”try again”, “still wrong”, “same problem” | Link consecutive turns into one incident |
| Unsafe uncertainty | ”are you sure”, “where did that come from” | Flag possible grounding or hallucination issue |
| Tool failure language | ”it didn’t open”, “nothing changed”, “can’t see it” | Flag tool-path or UI-state mismatch |
The phrase match should not decide the final quality label. It should create an observability ticket with the trace id, thread id, agency id, user message, assistant response, current model, playbook, tool path, and surrounding turns. A reviewer can then confirm whether it was a model issue, tool issue, UX issue, user confusion, or harmless false positive.
This is also where product observability differs from normal backend monitoring. A 200 response can still be a failed AI interaction. The model may answer fluently while missing the user’s constraint. A tool may return success while the user cannot see the result. A trace may have no exception but still deserve review because the human reaction says trust was lost.
The dashboard I would want is less like a server error list and more like an AI quality inbox:
| View | What it answers |
|---|---|
| Flagged phrases | Which live conversations contain correction, frustration, or confusion signals? |
| Tool-path incidents | Which tools are often followed by user corrections or retries? |
| Model route quality | Which models produce more downvotes, retries, or manual corrections by workflow? |
| Playbook drift | Which playbooks are generating more staff annotations or golden regressions? |
| Cost outliers | Which traces are correct but too expensive, slow, or retry-heavy? |
| Promotion queue | Which reviewed incidents should become eval cases? |
That closes the loop: observability finds suspicious production behaviour, manual review turns it into a label, the CLI pulls the labelled data into raw rows, promotion turns the strongest examples into datasets, and CI prevents the same failure from silently returning.
Observability without evals becomes a pile of dashboards. Evals without observability become stale tests. The loop needs both.
How this looked in Platfio
In Platfio, evals lived beside the normal app and library workspaces in an extended Nx monorepo.
The eval target was not the model in the abstract. It was the product workflow the agency user depended on. The table below is the same architecture viewed by ownership responsibility rather than filesystem shape.
The implementation crossed the product surfaces, the committed harness, and the CI path:
| Surface | Role |
|---|---|
apps/frontend | Human labelling UI: thumbs, stars, notes, golden markers, trace review entry points, and staff annotation flows |
apps/backend/containers/agents | Agentic engine: prompt/playbook execution, model routing, tool calls, thread state, cost, latency, stop reasons, and trace instrumentation |
apps/observe | Observability dashboard: flagged phrases, correction queues, trace incidents, tool-path anomalies, cost outliers, and promotion queues |
evals/ | Committed eval harness: CLI lifecycle, shared metrics, suites, datasets, and DeepEval test files |
| GitHub Actions | CI integration: run the committed eval suites on prompt, tool, model-routing, and agent-engine changes before release |
That split kept the quality loop product-native. The frontend collected judgement at the moment a human reviewed the run. The agent container emitted the trace evidence needed to replay and score the workflow. The observe surface made production quality issues visible. The evals/ workspace converted reviewed evidence into executable cases. GitHub Actions turned those committed suites into release evidence instead of a local-only experiment.
The committed harness split evals into three suites:
| Suite | Current eval | What it protected |
|---|---|---|
single-turn | completion-plan-details | Structured completion behaviour for filling plan details without invented facts |
multi-turn | who-are-you | Assistant identity, capability, and safety-boundary conversation |
multi-turn-agents | create-proposal | Playbook-backed proposal creation from an approved plan |
That split mattered because single completions, conversations, and tool-using agents fail differently. A single-turn completion can be evaluated around grounded fields and output shape. A multi-turn conversation needs to preserve identity, boundaries, and context across turns. A multi-turn agent eval needs the playbook, tool path, product state, and final handoff to be evaluated together.
Each eval directory owned its local contract: .dataset.json for committed cases, eval.yaml for suite metadata and run command, metrics.py for evaluator definitions, and test_<feature>.py for DeepEval execution. Shared lifecycle code lived under evals/cli and evals/lib, so individual evals stayed small and inspectable.
In Platfio language, the “Prompt Template” was the playbook: the reusable instruction pack and dynamic field schema that told an agent how to run a specific workflow. That might be app planning, proposal generation, support triage, code-review-style checks, screenshot QA, or handover preparation.
The harness persisted agent runs in the database: messages, selected playbook, execution config, tool calls, tool results, model route, artifacts, cost, latency, stop reason, and final output. That gave us enough evidence to inspect a run after the fact instead of trying to reconstruct what the model had seen.
We then built a small internal annotation UI over those traces. A reviewer could mark whether the run succeeded, identify the point where it went wrong, tag the affected capability, and add notes about the expected behaviour. That annotation layer turned messy production experience into labelled eval candidates.
Codex became part of the local eval-development loop. I would export or inspect annotated traces locally, then use Codex to cluster them into a failure-mode taxonomy: wrong playbook selection, missing discovery, unsafe tool choice, weak recovery, malformed output, hallucinated product state, excessive cost, or an answer that looked good but could not be used by the product. The human still owned the taxonomy, but the agent made it faster to turn a pile of real failures into testable categories.
For each important workflow, we turned representative traces into test cases with realistic inputs, product state, permissions, and expected behaviours. Those cases split naturally:
- Capability evals checked whether a playbook could perform the workflow at all across realistic variants.
- Regression evals locked in fixes for observed failures from annotated traces.
- Code-based checks validated deterministic contracts such as schema shape, required fields, tool allowlists, and renderable output.
- LLM-as-judge rubrics handled qualitative questions: did the agent ask the right discovery question, choose a safe next action, preserve the user’s constraint, or produce a handoff another human could actually use?
- GitHub Actions ran the suites before prompt, model-routing, agent-engine, or tool-surface changes shipped, so playbook edits had the same basic discipline as application code.
The lifecycle was explicit. capture pulled live backend behaviour into raw rows, fetch brought annotated production or staging examples into local raw datasets, generate created DeepEval goldens, promote moved selected rows into committed feature datasets, and run executed a suite or the whole harness. Judge scoring was opt-in because it spent model tokens; without the LLM flag, the suites could still validate dataset shape and skip judge scoring.
name: evals

on:
  pull_request:
    paths:
      - "evals/**"
      - "apps/frontend/**"
      - "apps/backend/containers/agents/**"
      - "apps/observe/**"

jobs:
  deepeval:
    runs-on: ubuntu-latest
    steps:
      - uses: actions/checkout@v4
      - uses: actions/setup-python@v5
        with:
          python-version: "3.11"
      - run: pip install -r evals/requirements.txt
      - run: python -m evals.cli.run
The important part was not the exact YAML. It was the ownership boundary: product UI changes, agent-engine changes, observability changes, and eval dataset changes all had a route into the same CI signal.
The practical answer to “the agent is unreliable” was not one bigger prompt. It was eval coverage around the workflows that mattered.
| Eval target | What it checked | Failure it caught |
|---|---|---|
| Playbook selection | The right workflow was injected for the task | Generic chat behaviour when structure was needed |
| Instruction following | Required steps happened in order | Skipped discovery, approval, or verification |
| Tool boundaries | The agent only asked for allowed product actions | Authority creep and unsafe tool use |
| Output shape | The result matched the product surface | Pretty text that could not be rendered or acted on |
| Cost and latency | The playbook was affordable enough to run repeatedly | A correct workflow that was too expensive to operate |
| Handoff quality | The next human could understand the state | A plausible summary with no usable next step |
That is the standard I would use again: make every important workflow observable, convert failures into datasets, choose metrics by failure mode, and wire the result into release decisions.
The operating standard
A serious eval and observability system should be able to answer these questions without drama:
- What changed between the last good run and this bad one?
- Which prompt, model, retriever, tool, release, tenant, and feature flag were involved?
- Did the model fail, or did we give it bad context?
- Did retrieval fail, or did generation ignore good evidence?
- Did the agent choose the wrong tool, pass bad arguments, or mutate unsafe state?
- Is this a new failure mode or a regression?
- Which dataset protects this behaviour now?
- Which eval result should block release, warn the reviewer, or create a follow-up?
- What is the owner and remediation path?
That is the difference between “we have evals” and “we can operate this system.”
The deep practice is not a framework choice. It is an engineering posture: traces are evidence, datasets are memory, metrics are targeted instruments, CI is a release decision system, and production failures are raw material for the next improvement loop.
AI products do not become reliable because someone added an eval job at the end. They become reliable when evaluation and observability are part of how the product learns.